2023-8-22 21:00 |
Bitcoin is forming a pattern that has historically led to the asset retesting a specific line. At present, this level would be found at $20,500.
Bitcoin Has Dropped Below The 200-Day SMA With The Recent CrashA few days back, Bitcoin observed a sharp crash that took the cryptocurrency’s price toward the $26,000 mark. As this plummet was already significant, many have wondered whether this was it or if the drawdown will continue.
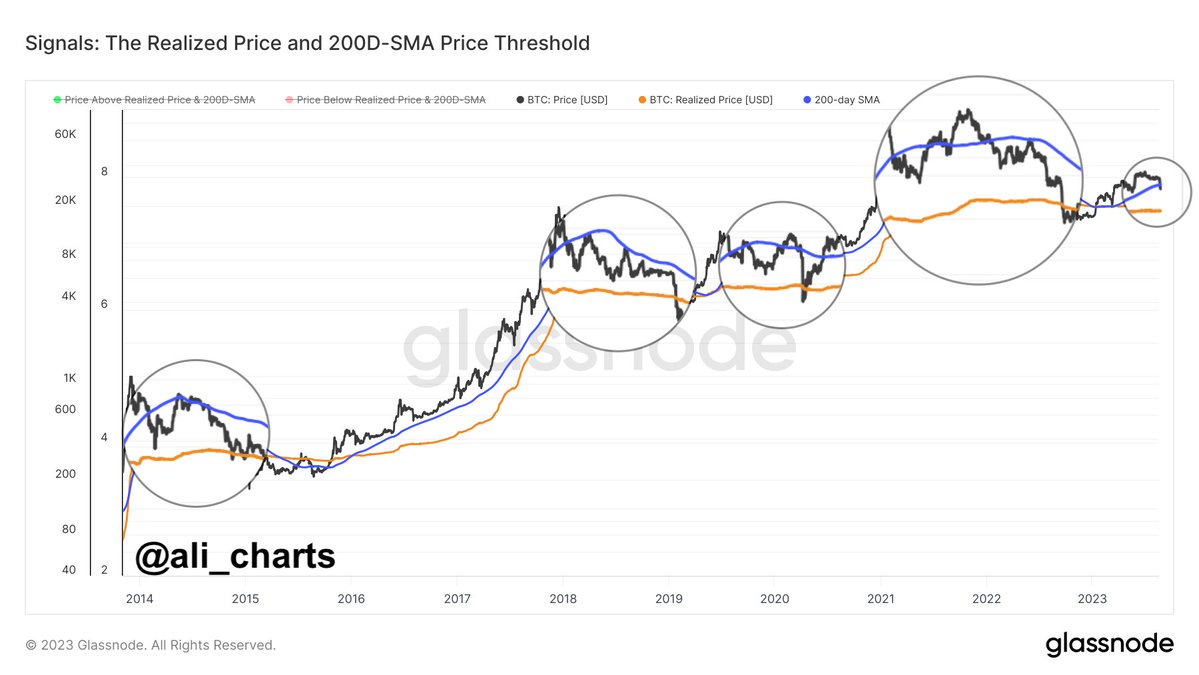
An analyst on X, Ali, shared a chart that may provide hints about where the asset could be heading next.
The analyst has attached the data for two Bitcoin-related metrics in the graph: the 200-day simple moving average (SMA) and the realized price. The chart shows that the BTC price has dropped below the 200-day SMA (colored in purple) with the latest crash.
According to the analyst, when the cryptocurrency’s price has crossed below this level during the past ten years, it has often retested the realized price (colored in orange).
The “realized price” here refers to the cost basis or the buying price of the average investor in the BTC market. This means that whenever the cryptocurrency dips below this level, the average holder enters a state of loss. On the other hand, breaks above the line imply a return to profits for most of the market.
Historically, this metric has had some interesting interactions with the spot price of the coin. During bullish periods, the line has generally supported the asset, while during bearish periods, it has acted as resistance.
The explanation behind these curious interactions may lie in how the investors’ minds work in each period. In bull markets, the average investor may think that the price will only go up, so whenever the asset drops to its buying price, they accumulate more of the asset.
Similarly, in bearish trends, the holders may believe the cryptocurrency will only go down, so the price they bought in (their break-even mark) would be the ideal exit opportunity.
This buying and selling may cause the level to act as support and resistance in the respective regimes. The latest example of this behavior was seen earlier in the year when Bitcoin rebounded off the line back in March.
As the asset now appears to have broken below the 200-day SMA, it may be heading towards a retest, as has often happened many times in the past.
Right now, the cost basis of the average investor is $20,500, which means that if BTC is going to touch this line again, a significant drawdown would need to occur.
If this scenario indeed plays out, then it’s possible that Bitcoin could find a rebound at the realized price once again. A retest failure, however, would be a very concerning sign, as it might signal the return of the bear market.
BTC PriceAt the time of writing, Bitcoin is trading around $26,000, down 11% in the last week.
origin »Bitcoin price in Telegram @btc_price_every_hour
Bitcoin (BTC) на Currencies.ru
|
|