2020-9-3 10:25 |
Bitcoin is going to fall to $9,800, according to a pseudonymous analyst.
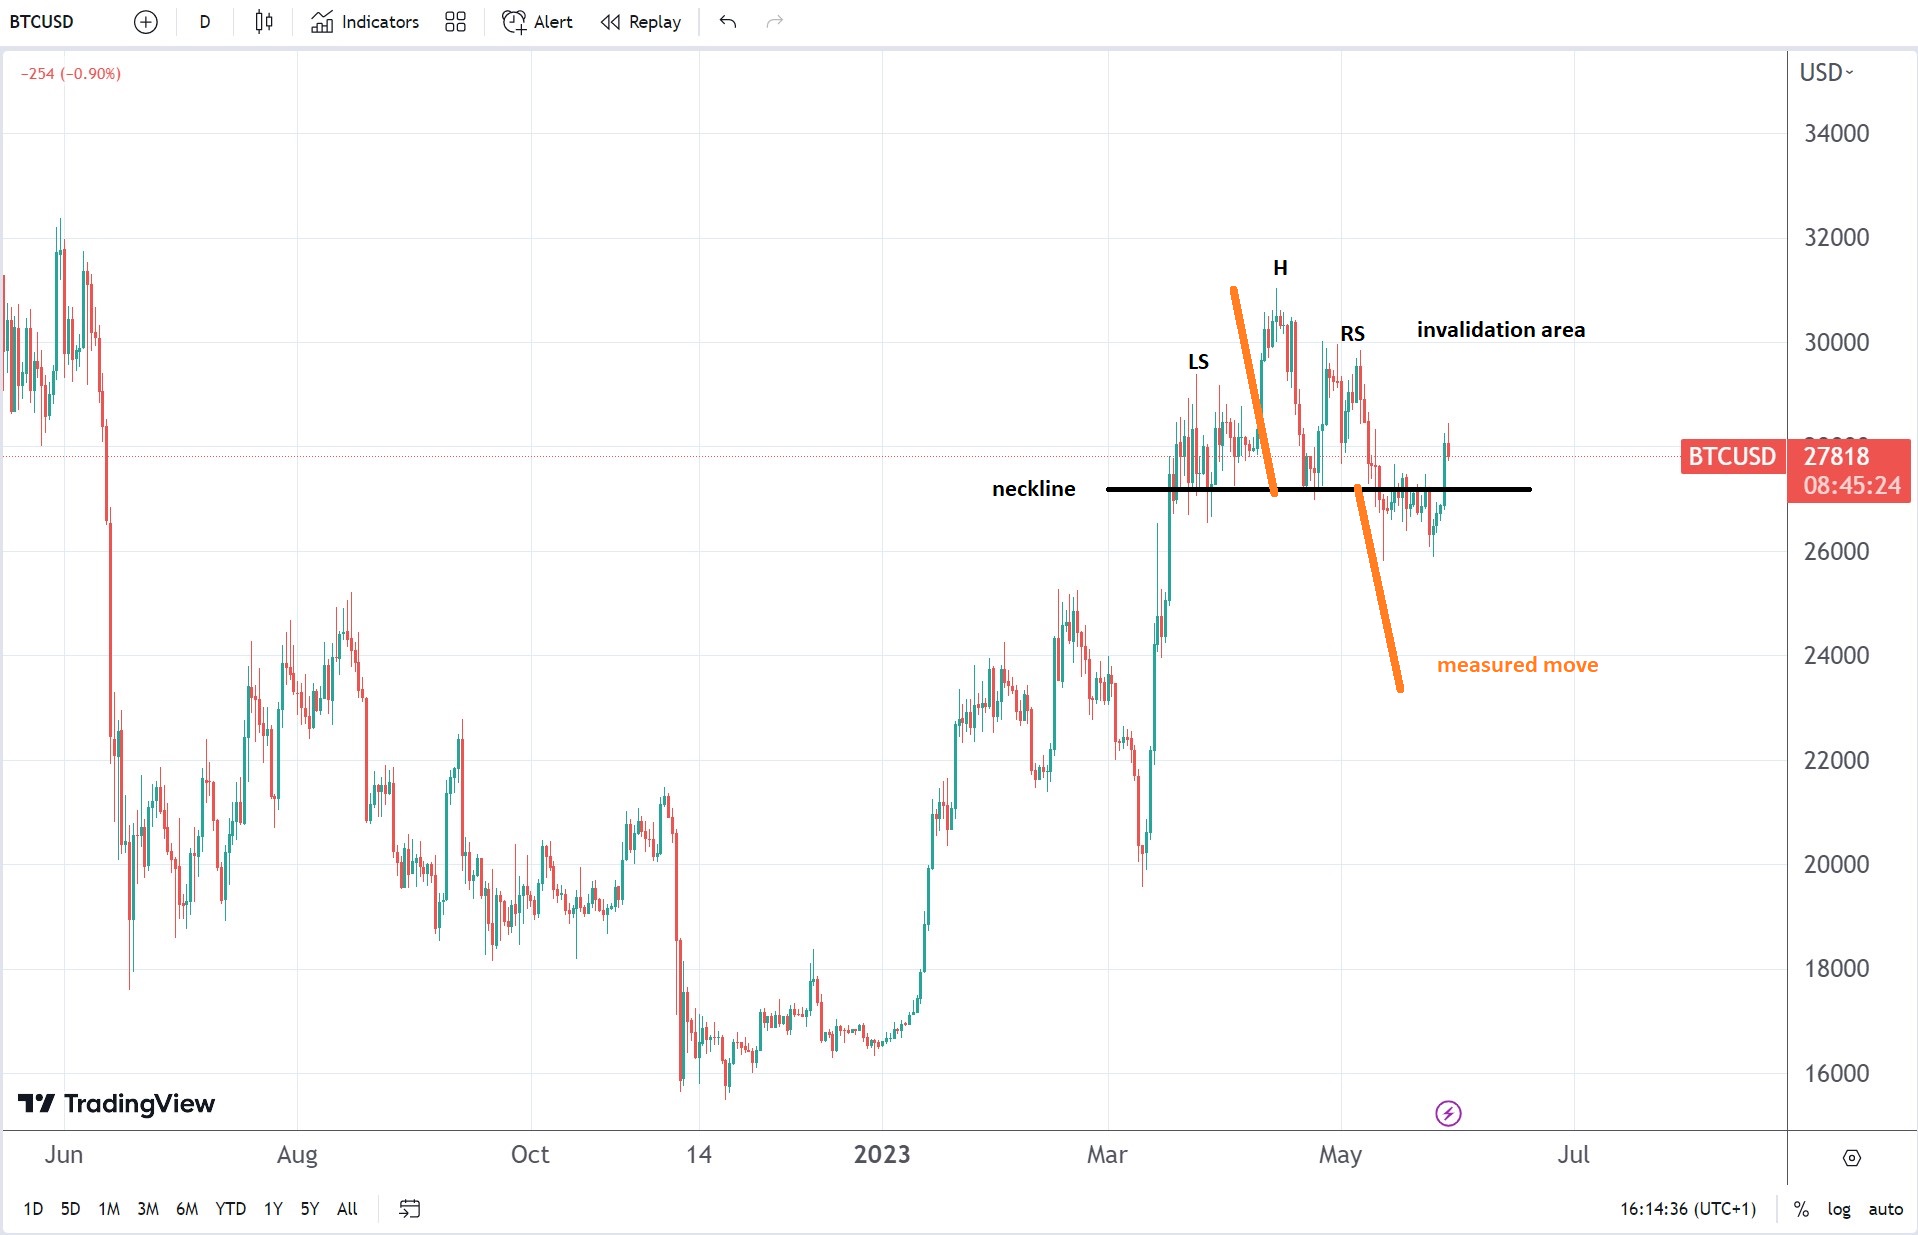
The prominent daytrader cited the formation of a Head and Shoulder pattern behind his bearish analogy. In retrospect, H&S is a technical pattern described by three peaks. The outside tips are higher in levels while the middle one is the highest. Meanwhile, they receive support from a so-called baseline. It is a bullish-to-bearish indicator.
Bitcoin H&S sets a downside target at $9,800. Source: TradingView.com, CryptoHamster
XBT/USD formed a similar pattern on its four-hourly BitMEX chart, as shown in the chart above. The pair made two peaks posing as shoulders and the one in the middle acting as head. Meanwhile, all the erections held firm above a baseline support level.
FractalThe analyst recalled a similar technical pattern that ended up in a negative breakout in February 2020. He said the indicator had the price lowered to a target level at $8,720, fearing the fractal could now repeat in the third quarter, with $9,800 in view as the H&S downside aim.
A Bitcoin fractal from February 2020 showing the price forming a similar H&S pattern. Source: TradingView.com, CryptoHamster
Fractals do not guarantee repetitions. Nevertheless, they tend to reveal how traders might behave based on their previous sentiments.
In February 2020, when XBT/USD crashed to $8,720, the global market was facing uncertainty from the rising COVID-19 pandemic. Meanwhile, investors had already seen a sharp reversal in the US stock indexes and gold amid an increasing bid for the US dollar. That also served as the reason behind Bitcoin’s fall.
But at present, many of the fundamentals have switched sides. The global central banks, on the whole, have injected $70 trillion worth of liquidity into the markets. Meanwhile, the US Federal Reserve has committed to buy bonds indefinitely and keep its benchmark lending rate near zero.
As a result, the US dollar earlier crashed to its two-year low. Meanwhile, Bitcoin rose by more than 200 percent from its March 13 nadir.
What’s Next for BitcoinThe latest round of downside correction in the Bitcoin market had two triggers: a recovering US dollar and a sentimental shift to the yield-rich decentralized finance sector.
Earlier this week, the US dollar index rebounded from its two-year low, following an optimistic report on the US manufacturing data. That coincided with a reduced demand for safe-haven assets, affecting both gold and Bitcoin.
Meanwhile, the benchmark cryptocurrency’s market dominance fell below 60 percent. It reflected a massive capital shift from the Bitcoin market to a booming decentralized financial sector. Some of the projects listed under the “DeFi” tag has earned their traders up to 5,000 percent YTD gains already.
Bitcoin dominance falls to its 15-month low. Source: TradingView.com
Nevertheless, these factors have not hurt Bitcoin drastically. The cryptocurrency continues to hold above key support levels, with long-term investors looking at an extended period of lower interest rates and inflation as their reason to stay bullish.
Some of them expect XBT/USD to hit $20,000 by the end of this year.
origin »Bitcoin price in Telegram @btc_price_every_hour
Bitcoin (BTC) на Currencies.ru
|
|