2020-6-15 14:38 |
Bitcoin is trading lower after dipping below a critical level, with extended losses potentially bringing prices to around $8,100
Bitcoin is set to turn bearish as price breaks below $9,300 to nosedive past key support. Despite its resilience since the March market crash, the price of Bitcoin has dropped to lows of $9,050 in the past 24 hours after recently testing highs of $10,500.
It is a move that gives bears a likely opportunity to mount a challenge that could plunge the cryptocurrency below the critical ascending triangle pattern.
The pattern is a key bullish technical indicator for macro prices, so a break below would invalidate the bullish momentum that has held since early May.
Bitcoin’s 3.3% decline means it is trading below the ascending triangle support. Price breakdowns below these levels usually mean a drop matching the triangle’s height. The current pattern puts the potential retracement at a height equivalent of $1,800, which means prices could continue to slip down to levels around $7,500.
Fig 1: Chart of Bitcoin price showing decline past the Ascending Triangle. Source: TradingView.comBitcoin’s price has also moved below the 50-day moving average, which held as support in a tight range where prices have oscillated between $9,900 and $9,300 over the past month.
That leaves any further downsides relying on support at the 100-day and 200-day moving averages. The 200 MA falls at around $8,100. An upside from this bottom, however, is set to see prices rise to bring back highs of $11,800.
Fig 2: Bitcoin price chart showing a break below 50 MA: Source: TradingView On-chain metrics suggest a price breakdown is likelySeveral on-chain metrics suggest things are turning dire for Bitcoin’s price. BlockTree’s Charlie Morris has noted that the price is likely to drop because network velocity, transaction value, average transaction size and network fees are all down.
The 1-week miner rolling inventory (MRI) is at 85% while it’s up to 94% in the past 24 hours according to data from on-chain analysis platform ByteTree. The 5-week MRI is at 103% to mean miners have sold more bitcoins than they mine. If the figure rises to these levels in the short term, it could be difficult for prices to hold up above $9k.
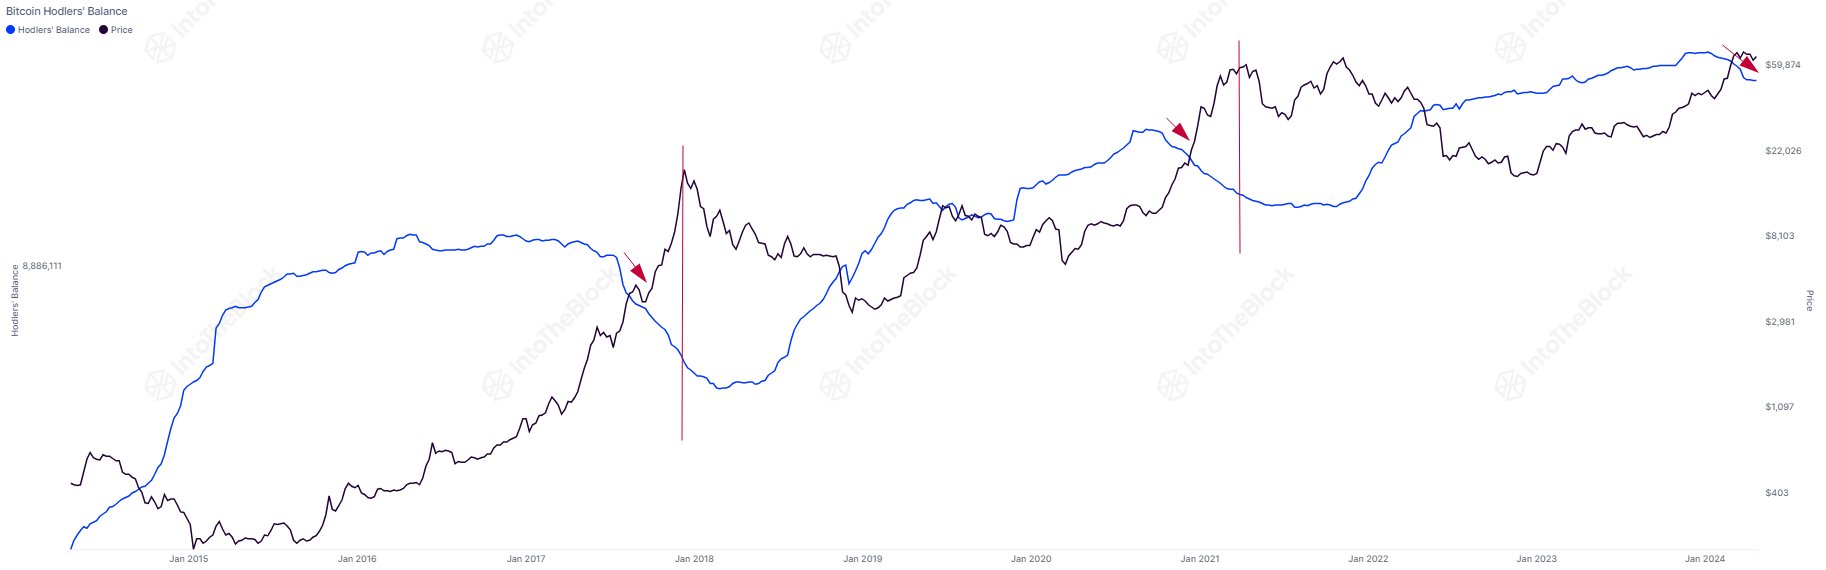
Meanwhile, the number of addresses holding more than 0.1 bitcoins has crossed 30 million. A dip at current prices may present another buying opportunity for long term investors.
Fig 3: Chart showing surge in the number of addresses holding +0.1 bitcoins. Source: GlassnodeThe post Bitcoin struggles to hold ascending triangle pattern appeared first on Coin Journal.
origin »Bitcoin price in Telegram @btc_price_every_hour
Bitcoin (BTC) на Currencies.ru
|
|