2024-4-26 06:00 |
The market intelligence platform IntoTheBlock has pointed out a Bitcoin pattern that could suggest there is still plenty of time to go in the cycle.
Bitcoin Long-Term Holder Pattern Could Suggest Bull Market Isn’t Over YetIn a new post on X, IntoTheBlock discussed a pattern that the total holdings of Bitcoin long-term holders have generally followed during bull markets in the past.
The “long-term holders” (LTHs) refer to investors who have been holding their coins for longer than a year (as defined by IntoTheBlock; other analytics firms use a different cutoff) without having sold or moved them on the blockchain.
Statistically, the longer an investor holds onto their coins, the less likely they become to sell at any point. As such, the LTHs, who hold for significant periods, are considered the unyielding section of the market.
The LTHs also display this resilience in practice, as they rarely sell despite whatever may be going on in the wider market. Recently, however, these investors have been participating in a selloff.
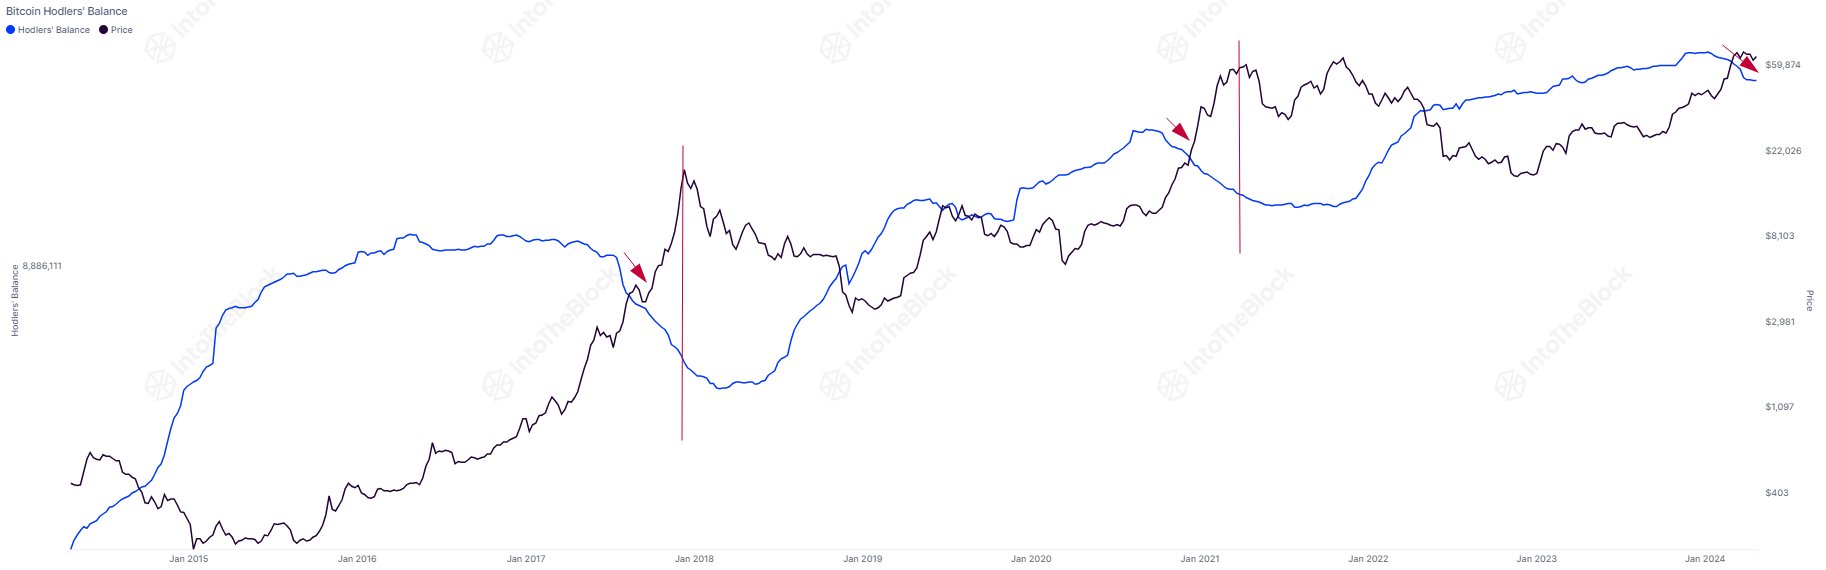
Given that this event isn’t exactly a common one, it can be something to note. Below is the chart shared by the analytics firm that shows the trend the combined holdings of the investors in this cohort have followed over the last few years.
As the graph shows, Bitcoin LTHs accumulated during the 2022 bear market and the 2023 recovery rally, but recently, their holdings have turned towards the downside.
Something to keep in mind is that a one-year delay is naturally attached to buying from this group, as only investors who have held for at least a year can be part of the cohort.
This means that when the LTH holdings go up, it doesn’t suggest that buying is happening in the present but rather that it occurred a year ago, and these coins have matured enough to qualify for the cohort.
However, the same doesn’t apply to selling, as the coins’ age instantly resets back to zero as soon as these investors remove them from their wallets. As such, the recent downtrend would reflect a selloff that is happening in the present.
“Data indicates that these seasoned holders initiated their sales in January and accelerated in late March,” notes IntoTheBlock. Interestingly, the chart highlights that a similar pattern was observed during the last two bull runs.
It would appear that these HODLers tend to start selling when the Bitcoin bull run starts properly and continue to sell beyond the top. Going by this pattern, the intelligence platform suggests, “there is plenty of time remaining when compared to previous cycles.”
BTC PriceAt the time of writing, Bitcoin has been floating around $64,400, which is up over 1% in the past week.
origin »Bitcoin price in Telegram @btc_price_every_hour
Bitcoin (BTC) на Currencies.ru
|
|