Bitcoin up for a long run as it re-visits an old bullish pattern

Bitcoin up for a long run as it re-visits an old bullish pattern
фото показано с : ambcrypto.com

2019-6-17 02:30

The price of Bitcoin saw a sudden surge that took its price above $9k, a long-awaited breach in resistance. The coin started to pump late June 15 and continued to rise on June 16. Many speculated the reason behind this pump, however, a crypto enthusiast highlighted a familiar pattern of Bitcoin.

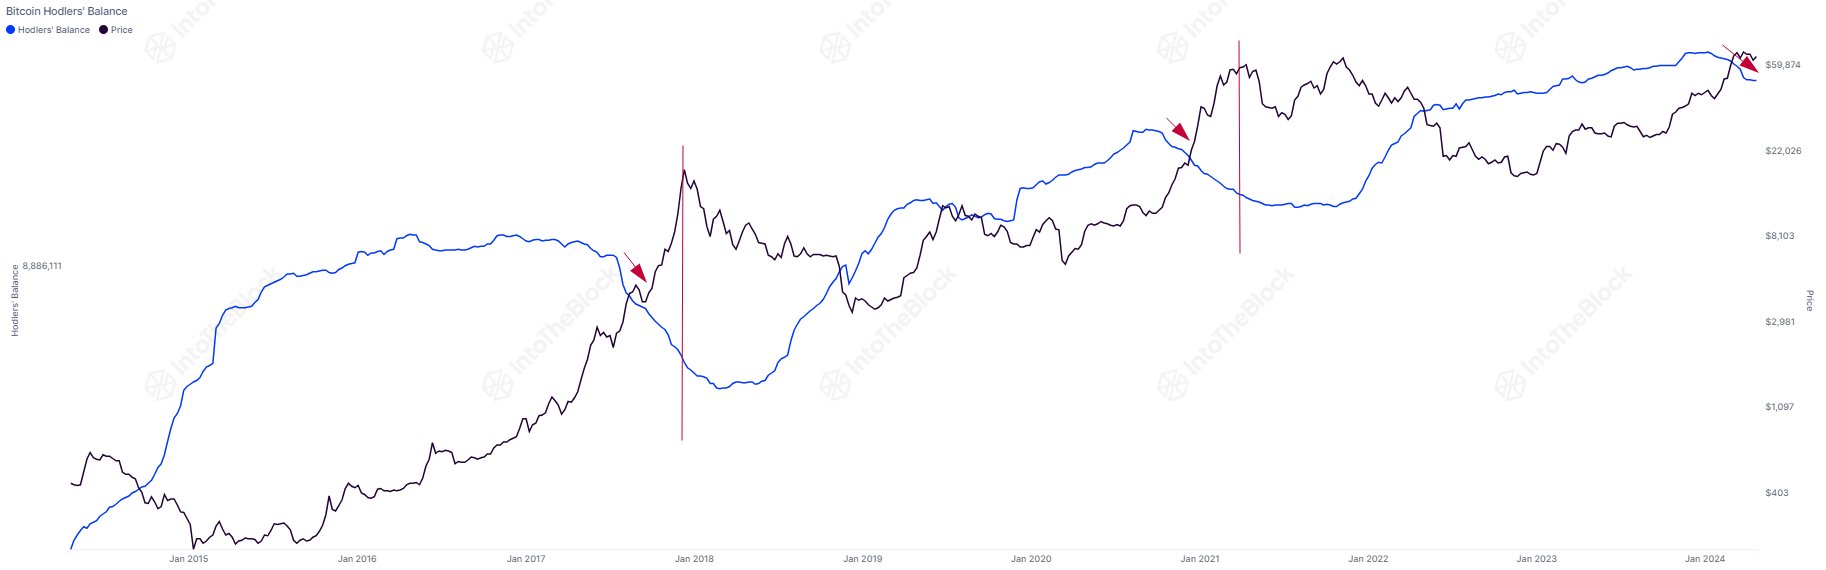
According to a Twitter user, @MoonOverlord informed that Bitcoin had already broken the non-linear regression curve median line. They also noted that the last time Bitcoin broke this pattern, it went from $2,500 to $20,000, and with history repeating itself, the coin just might move swiftly to $60,000.

Source: Twitter

However, the users are concerned about the volume of Bitcoin. Twitter user @OnBeforeDawn said:

“It feels good but it also feels like the rug is gonna get pulled out from everyone’s feet soon.”

The king coin was falling at press time, by over 5%, hinting at recovery that is underway. Bitcoin was valued at $9,049.42 with a market cap of $160.74 billion. The 24-hour trading volume of the coin was reported to be $22.05 billion as the coin surged by 4.30% over the past day. In the past seven days, the coin spiked by 14.85% but fell by 1.36% within an hour.

The post Bitcoin up for a long run as it re-visits an old bullish pattern appeared first on AMBCrypto.

Similar to Notcoin - TapSwap on Solana Airdrops In 2024

origin »

Bitcoin (BTC) на Currencies.ru

$ 67020.67 (-0.18%)
Объем 24H $15.757b
Изменеия 24h: 0.08 %, 7d: 10.06 %
Cегодня L: $66856.94 - H: $67251.24
Капитализация $1320.359b Rank 1
Цена в час новости $ 9160.16 (631.65%)

bitcoin pattern pump june price run long

bitcoin pattern → Результатов: 126


Фото:

Bitcoin Has “Plenty Of Time” Remaining In Bull Cycle, IntoTheBlock Explains Why

The market intelligence platform IntoTheBlock has pointed out a Bitcoin pattern that could suggest there is still plenty of time to go in the cycle. Bitcoin Long-Term Holder Pattern Could Suggest Bull Market Isn’t Over Yet In a new post on X, IntoTheBlock discussed a pattern that the total holdings of Bitcoin long-term holders have […]

2024-4-26 06:00


Фото:

Bitcoin’s Latest Bart Pattern Splits Analysts

Over the weekend, the Bitcoin price did not experience significant movement. Its price traded in a range between $8700-$8800 — a very small range, especially for cryptocurrencies. During quiet trading sessions such as these, a common occurrence has been the creation of the Bart pattern — named after The Simpsons character, since the price movement […] The post Bitcoin’s Latest Bart Pattern Splits Analysts appeared first on BeInCrypto.

2019-11-11 17:26


Bitcoin’s fractal nature allows extrapolation of 2017 price pattern; predicts correction in the next two days

Bitcoin has been called a lot of names. From a bubble to a Ponzi scheme, to Tulip-mania and a scam. Nevertheless, it has never ceased to amaze and prove all naysayers wrong. The pattern that Bitcoin’s price is following is quite similar to Gold’s prices from 1979 to 2000, the DotCom bubble from 1997 to 2002, […] The post Bitcoin’s fractal nature allows extrapolation of 2017 price pattern; predicts correction in the next two days appeared first on AMBCrypto.

2019-6-27 17:07