2022-6-16 12:45 |
After eight successive bearish candlesticks since June 7, Bitcoin (BTC) created a bullish candlestick with a long lower wick on June 15.
BTC has been decreasing since reaching an all-time high price of $69,000 in Nov. Until now, the downward movement has led to a low of $20,715 on June 15.
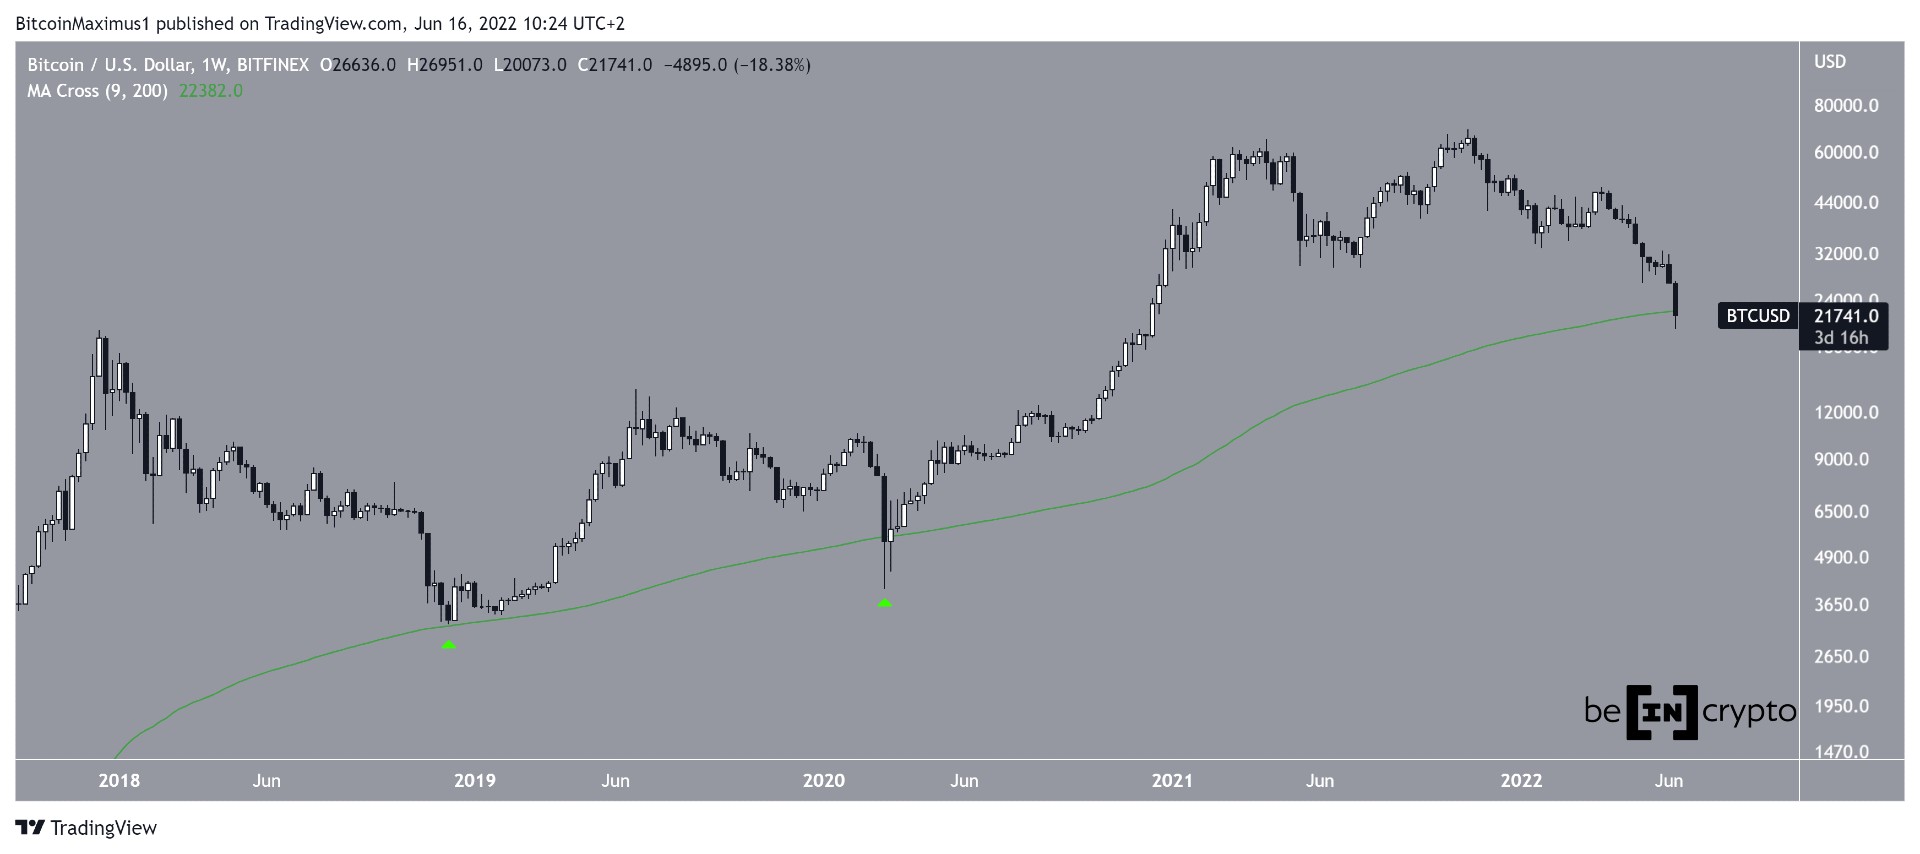
An important development is the fact that the price has reached its 200-week moving average (MA). The MA was also reached in Dec 2018 and March 2020. Both these levels marked absolute bottoms after which a significant upward movement followed.
Despite several long lower wicks, the price has only briefly reached a weekly close below this MA, which is currently at $22,300, and never done so for a sustained period.
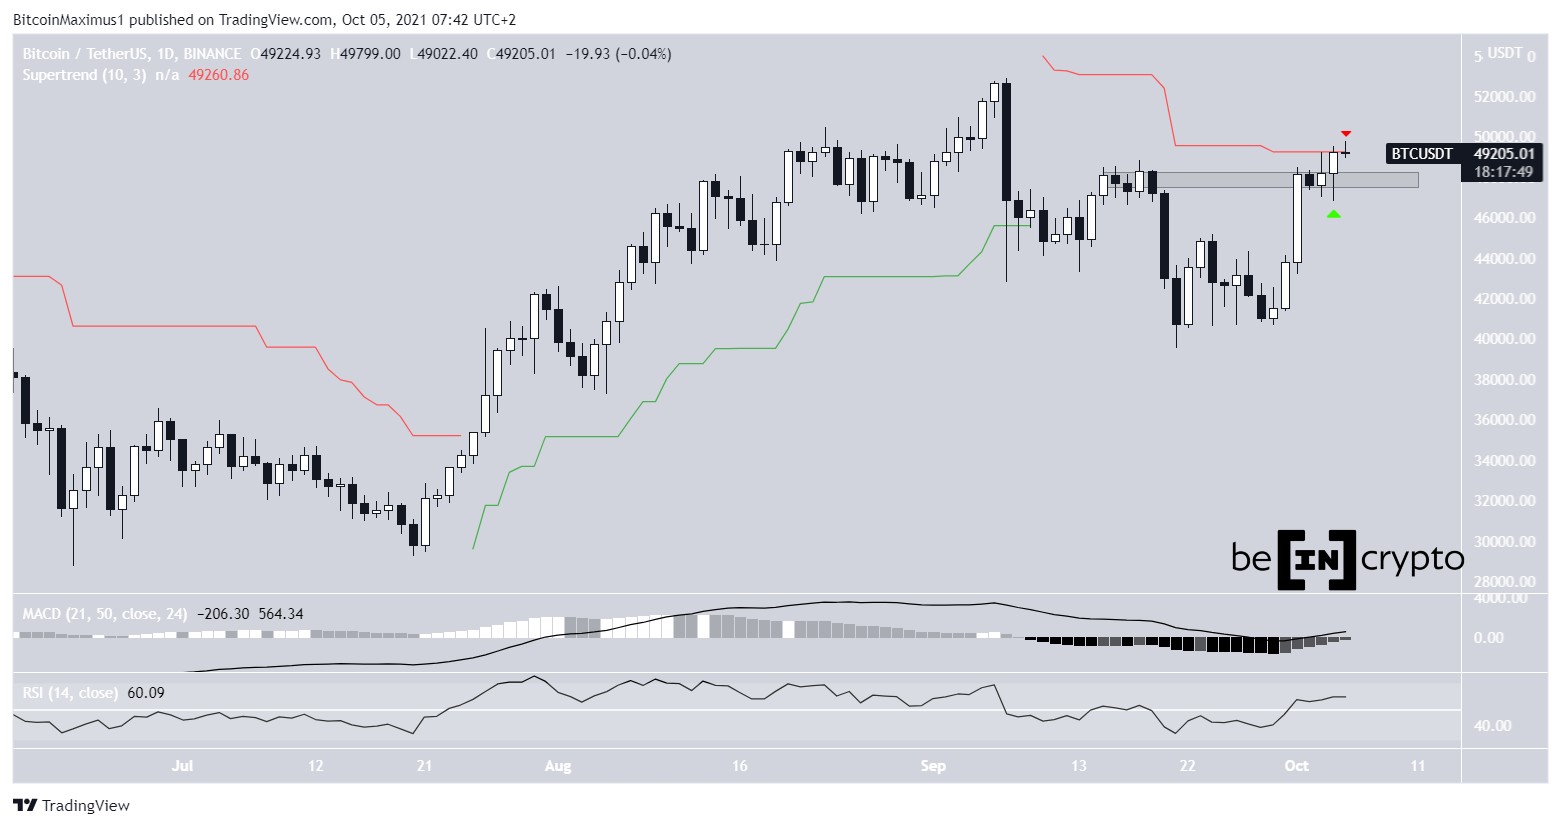
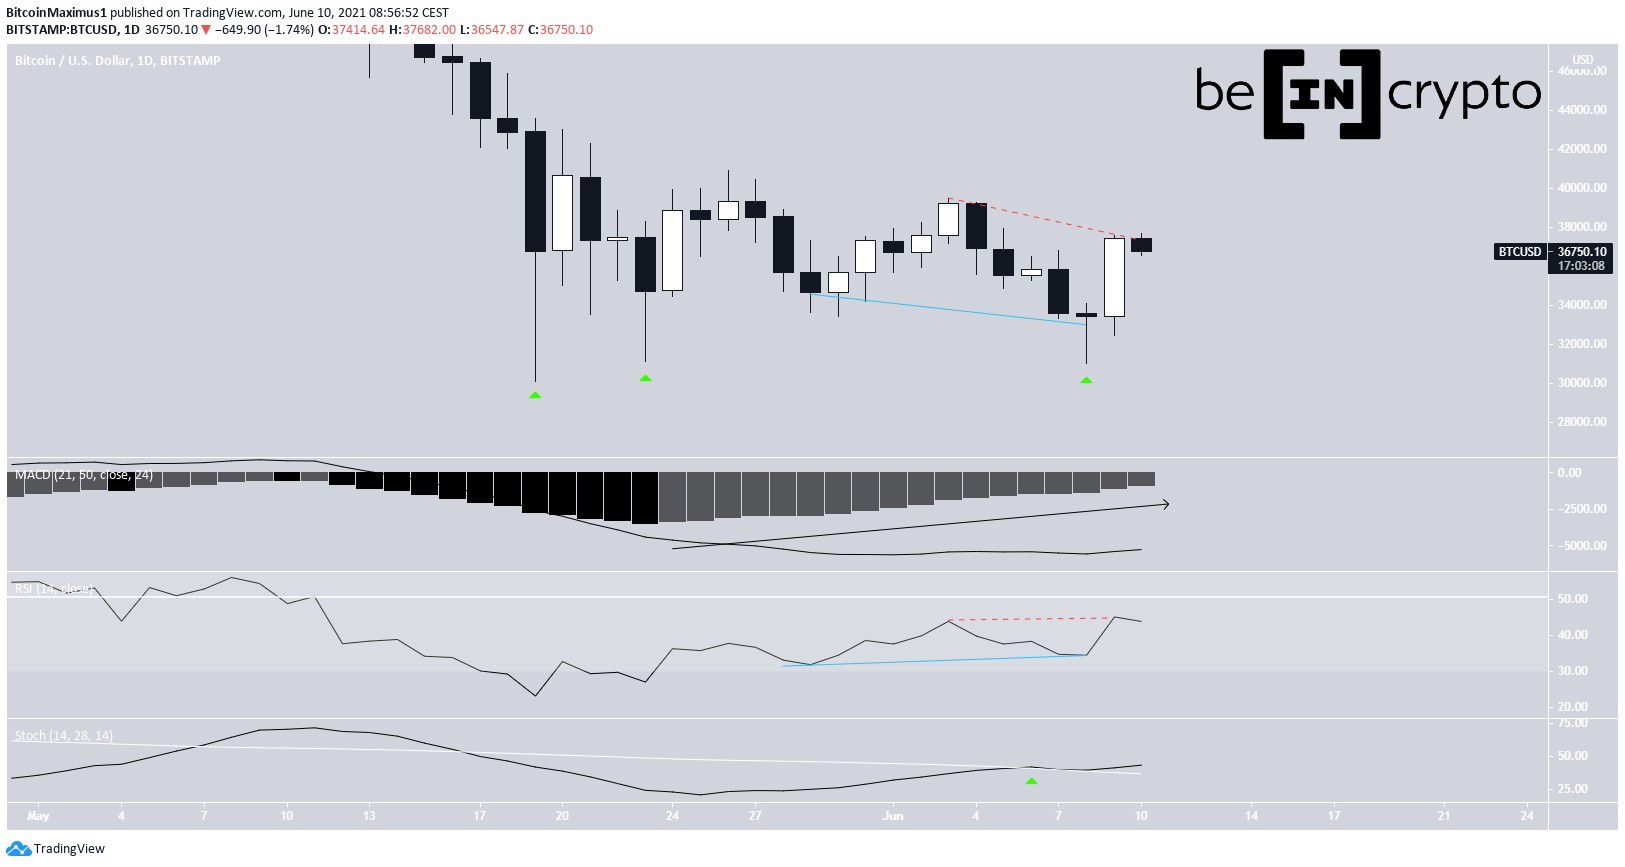
BTC/USD Chart By TradingView Daily hammer candlestickOn June 15, the price created a bullish hammer candlestick, which is characterized by a long lower wick and subsequent bullish close.
Since the candle is coming after such a sharp fall, it bodes well for the possibility of a reversal, especially if the price manages to create several successive bullish candlestick.
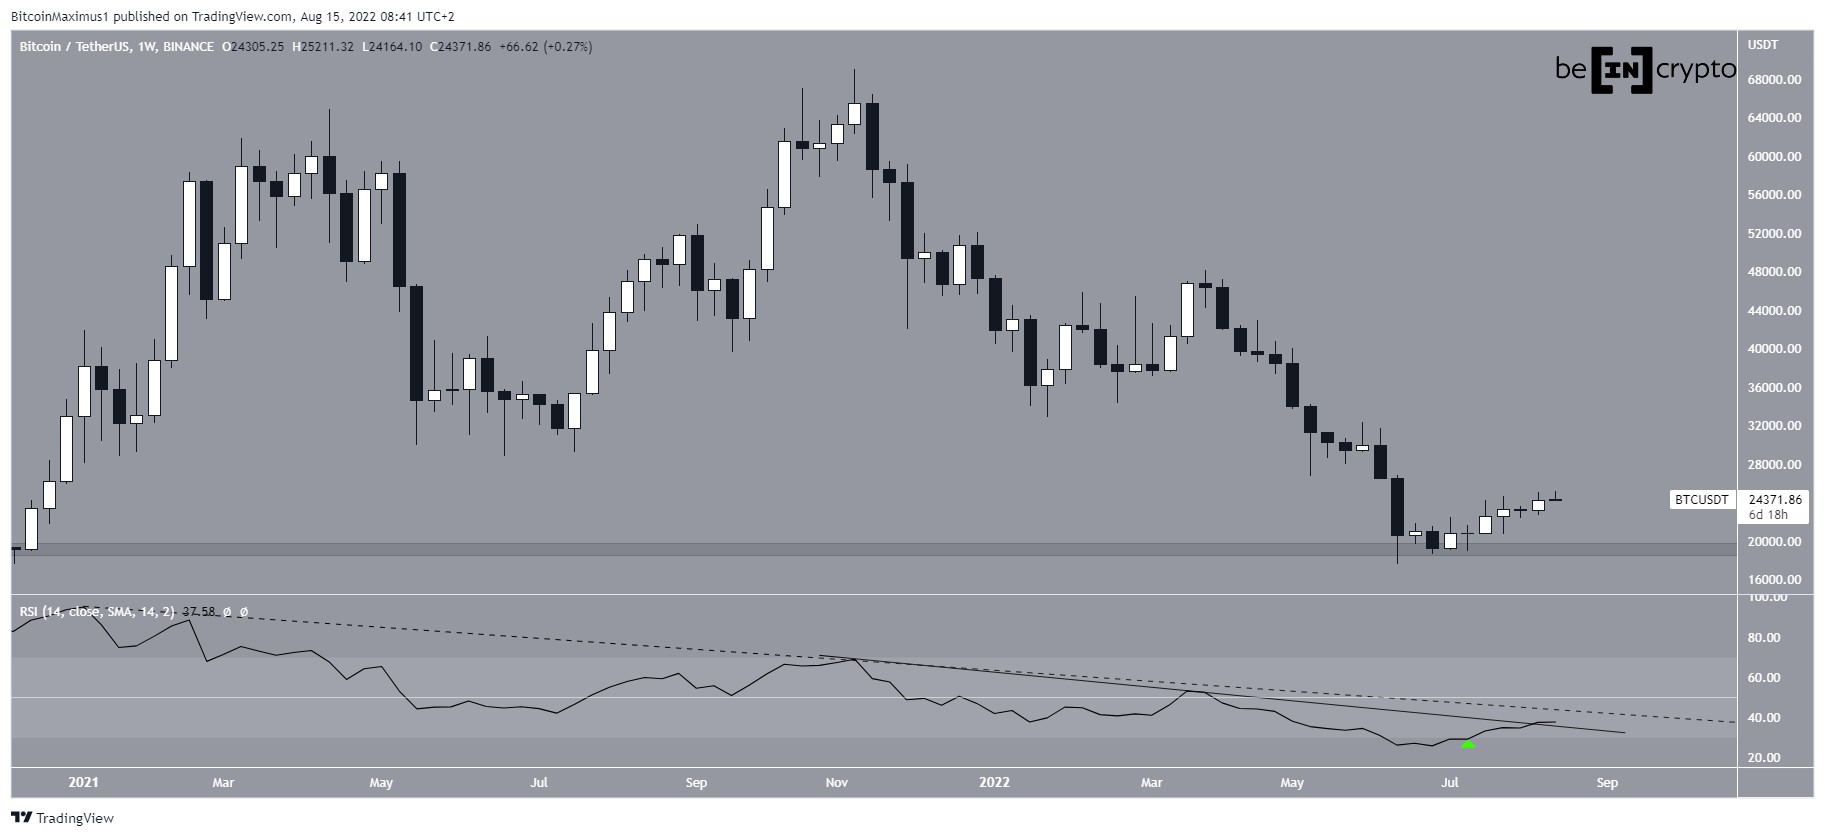
But, while the RSI is oversold at 22, it has not generated any bullish divergence yet.
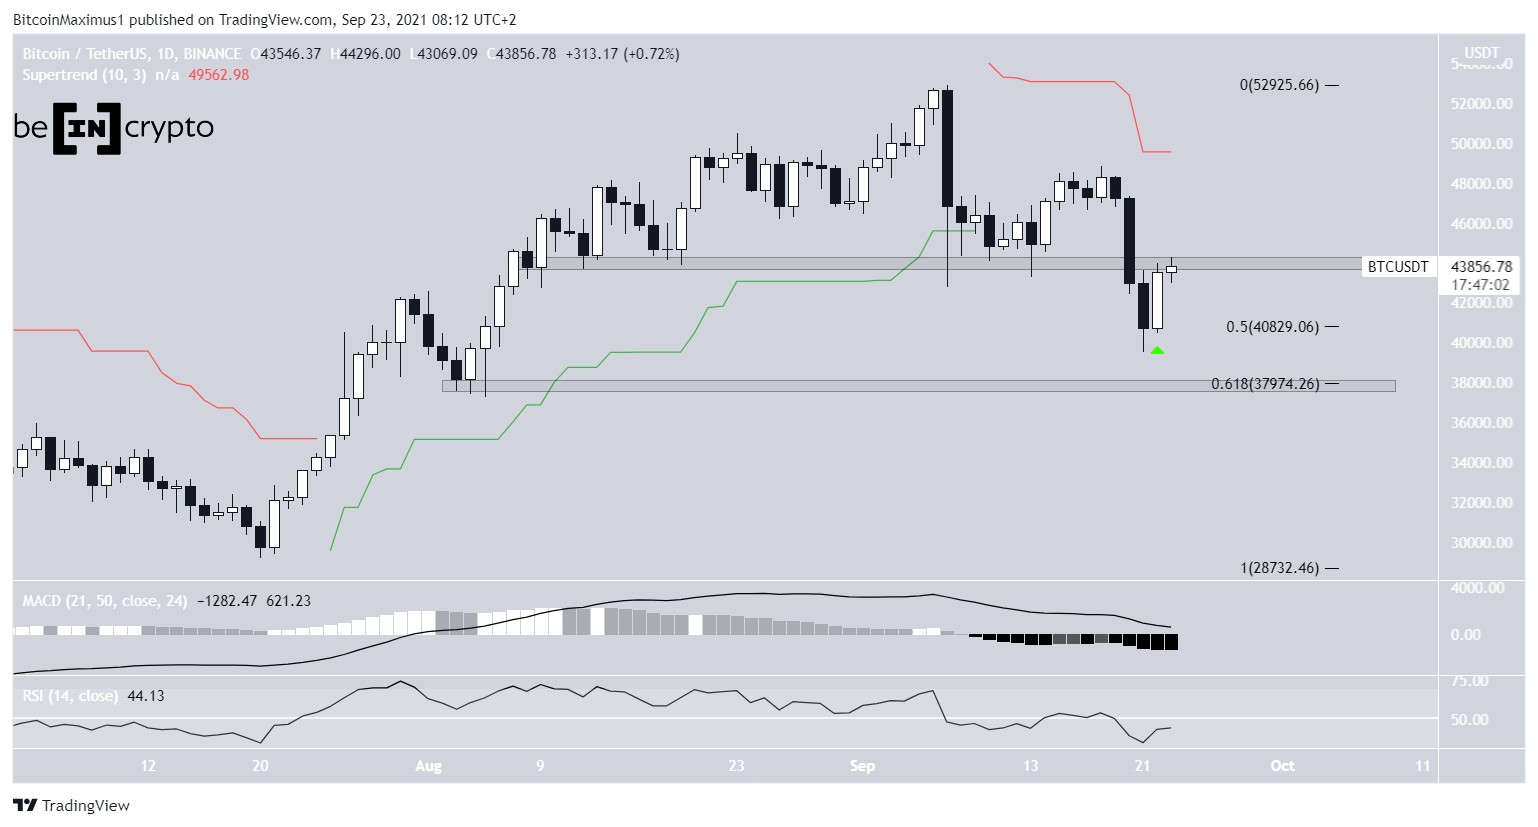
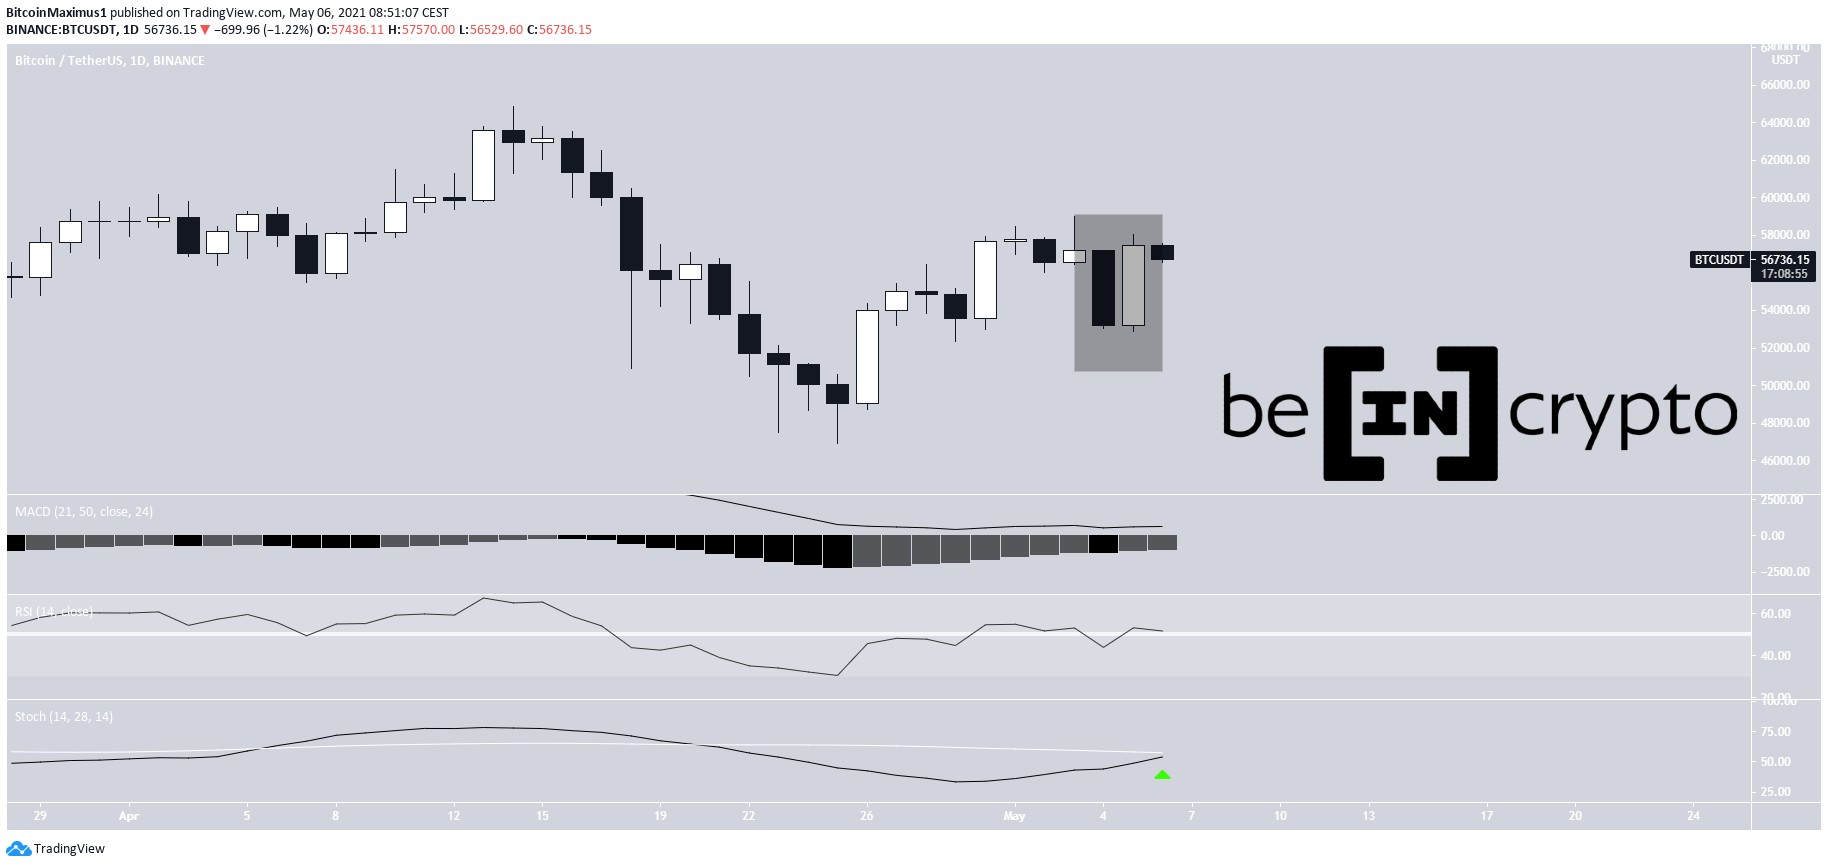
BTC/USDT Chart By TradingViewThe candle holds similarities to that of March 13 2020, when a similar bullish candlestick was created after a sharp fall and a RSI of 15, which albeit did not have any bullish divergences.
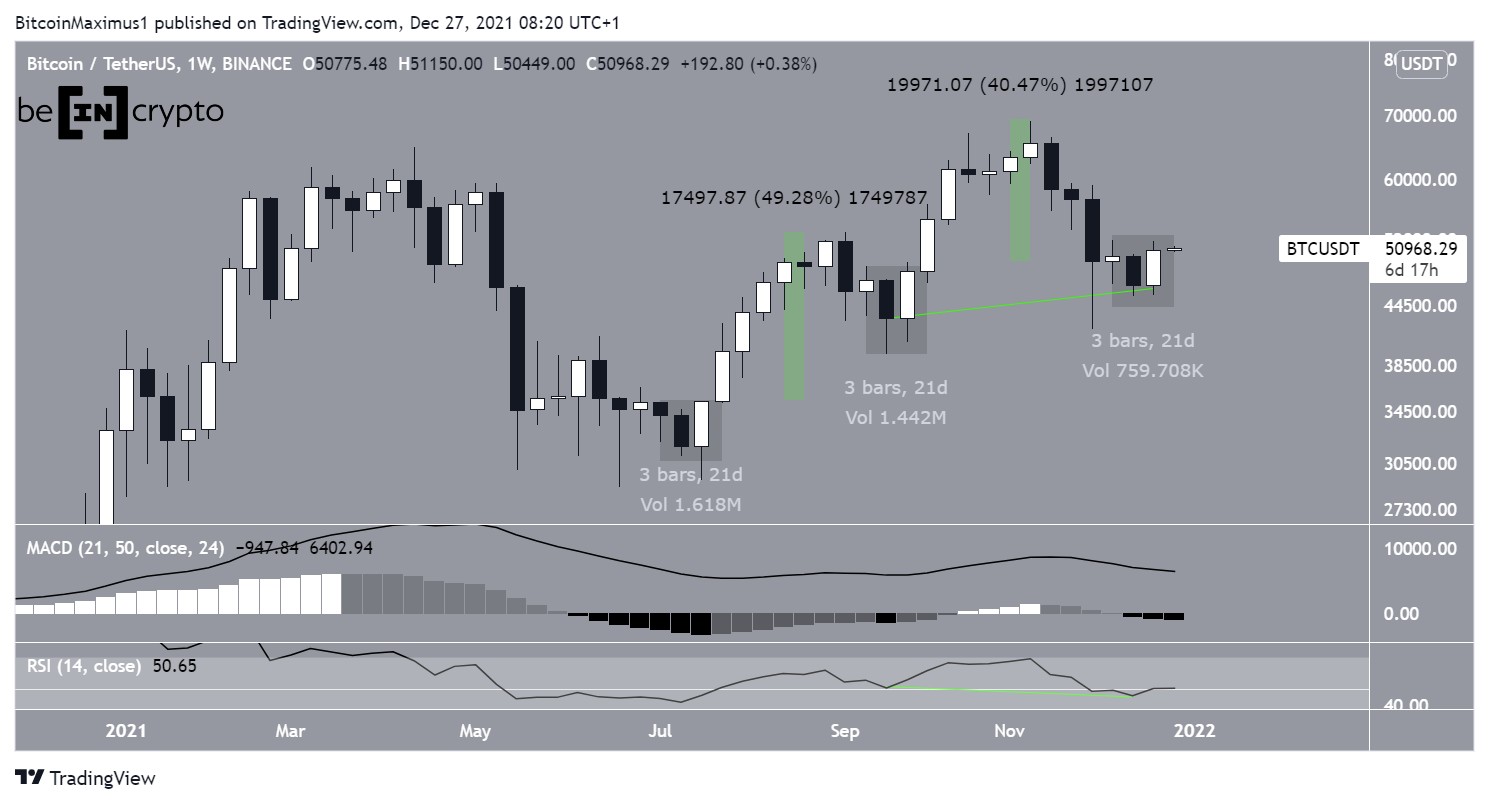
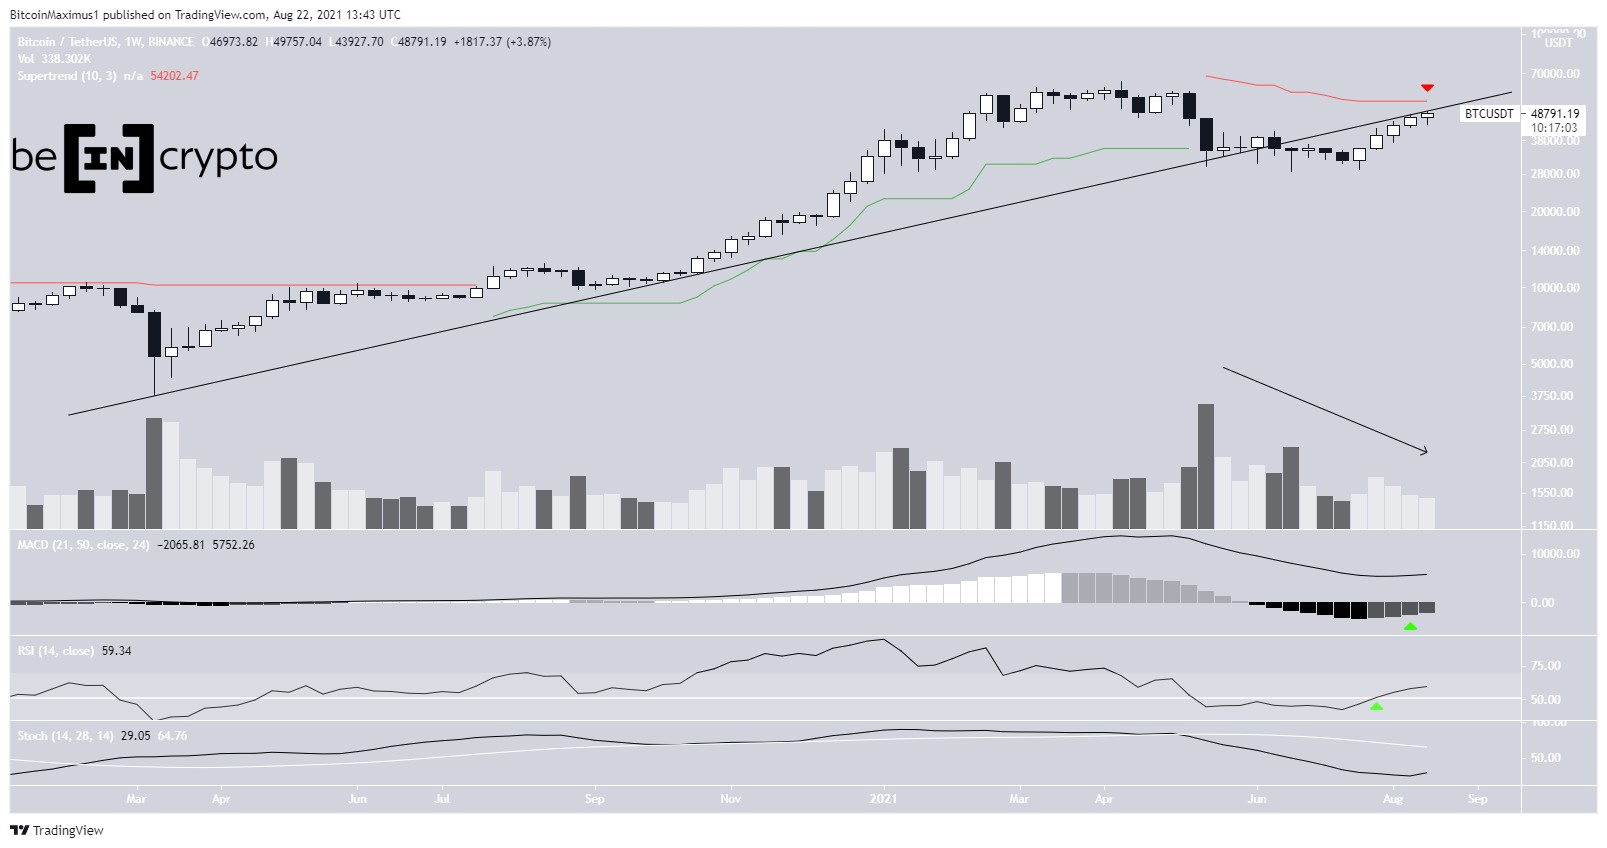
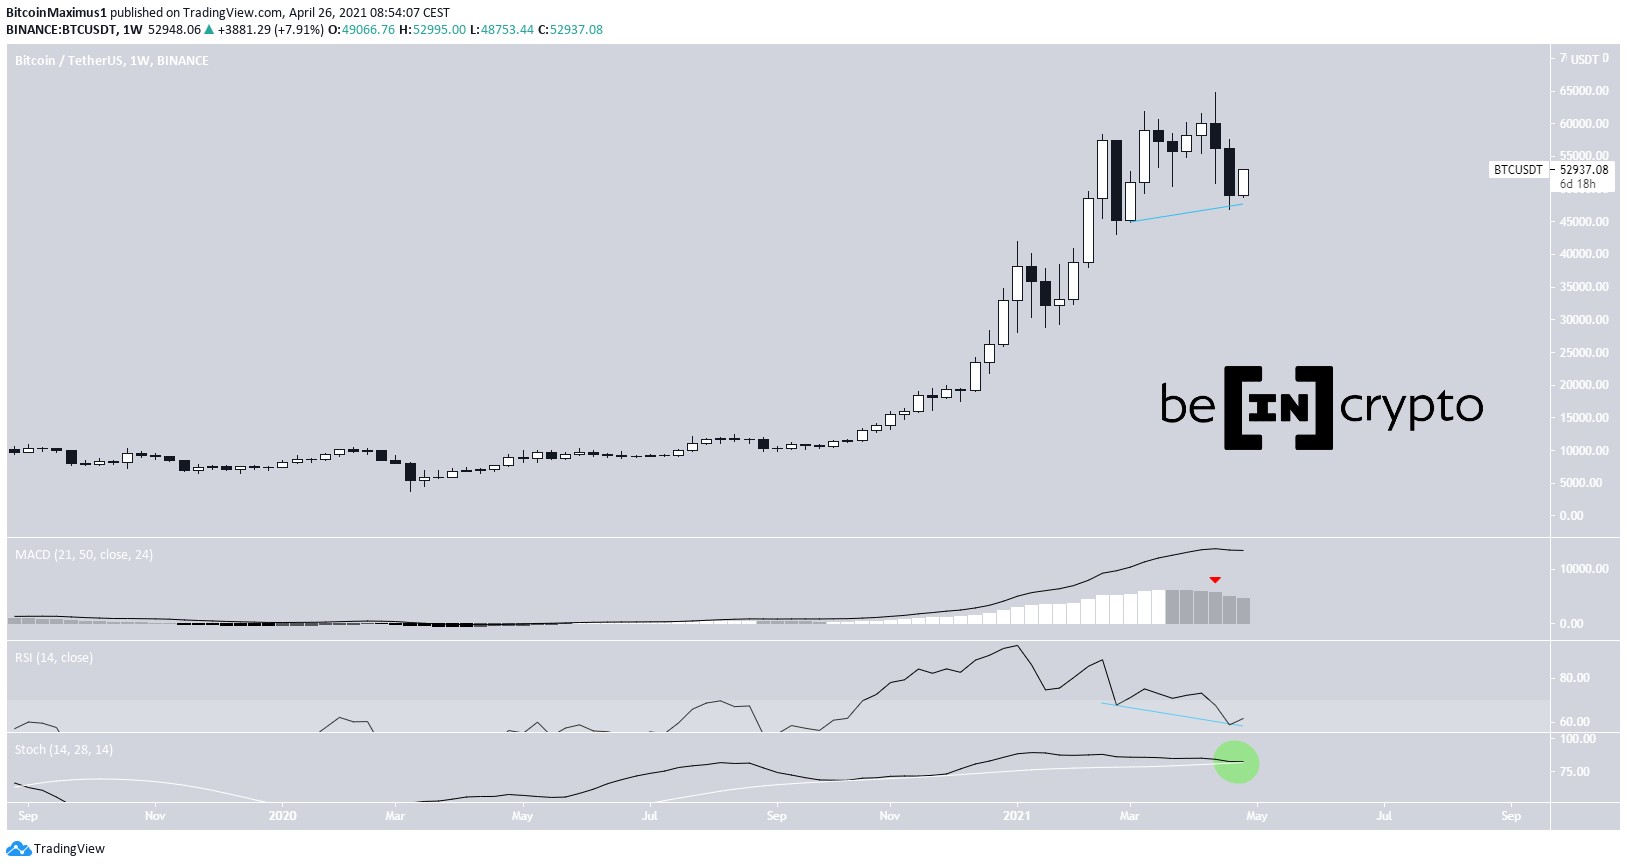
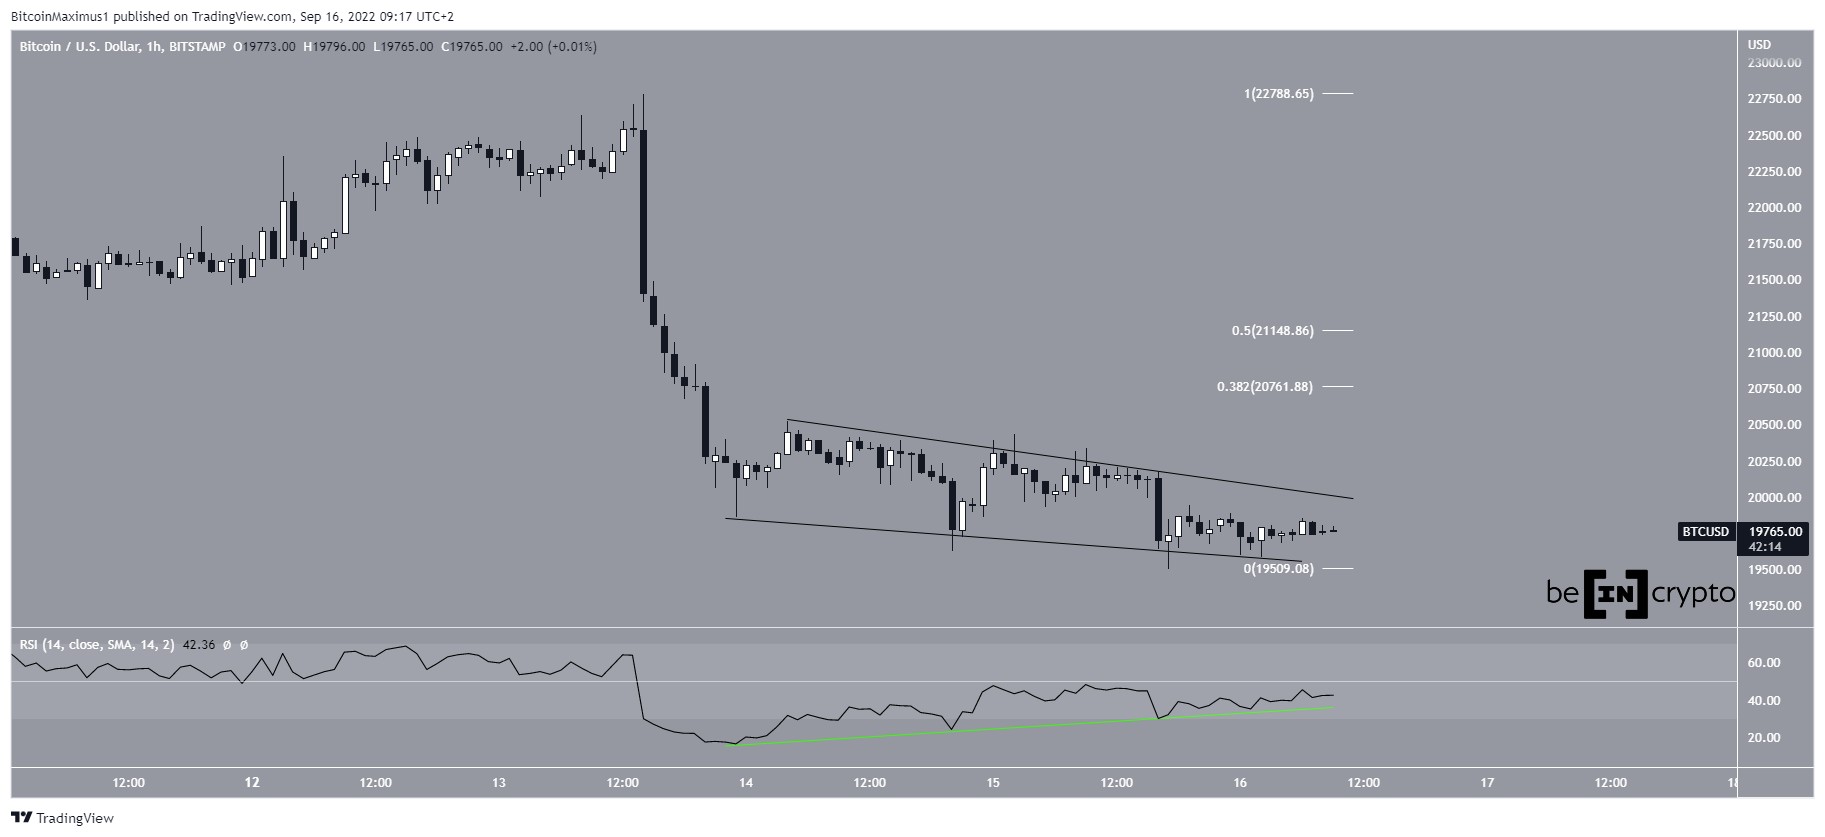
BTC/USDT Chart By TradingView Short-term BTC movementThe short-term count suggests that the price has possibly completed a five wave downward movement. The sub-wave count is shown in yellow, in which waves A:C have had an exact 1:1 ratio.
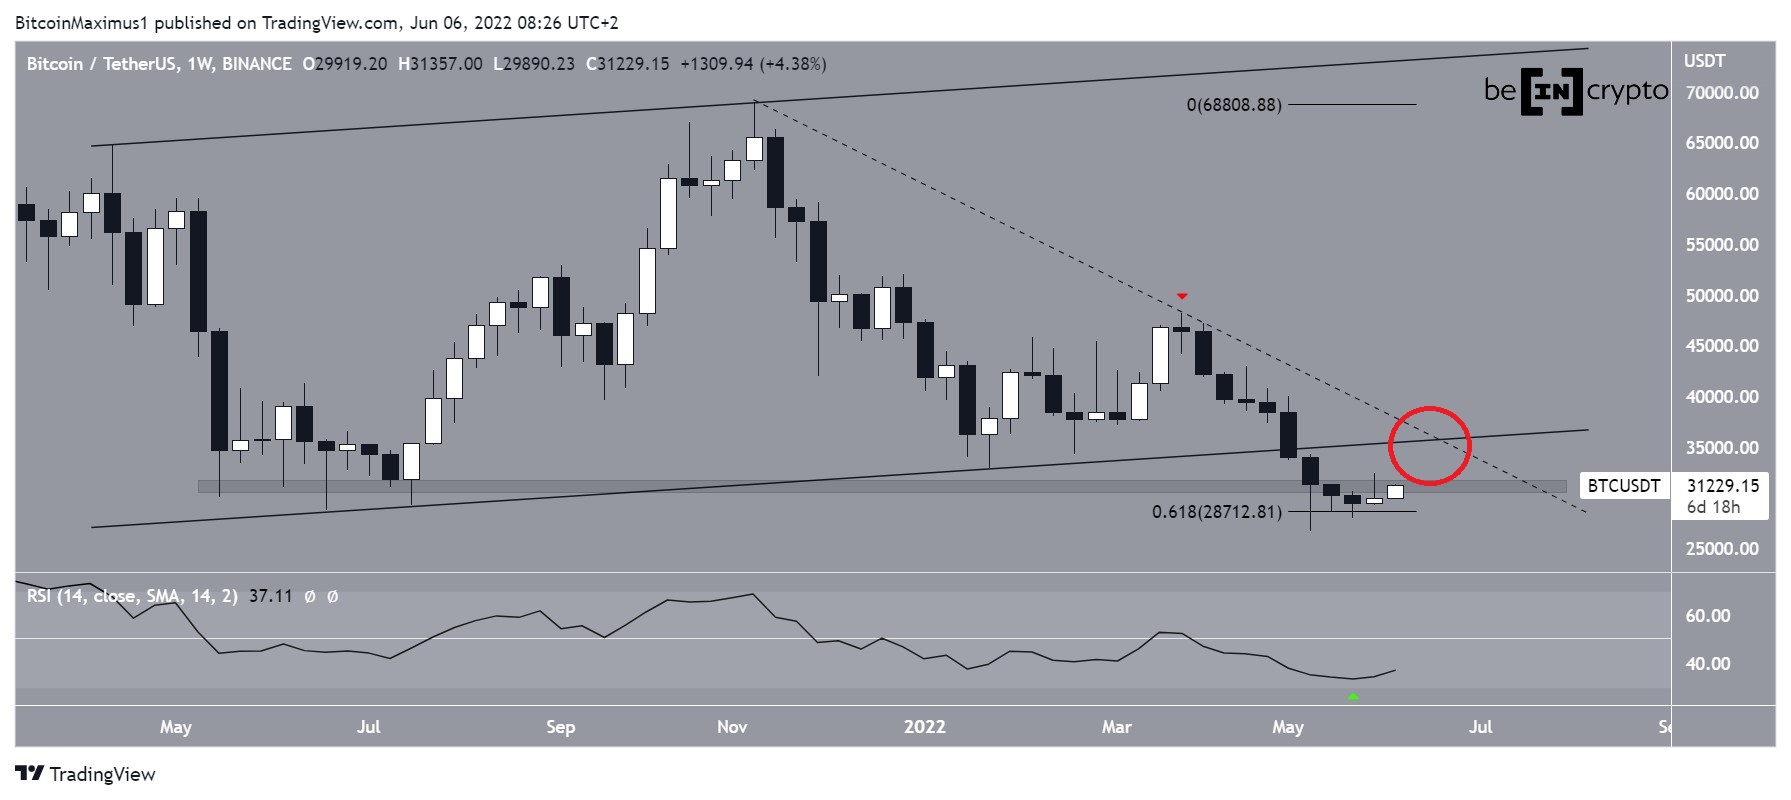
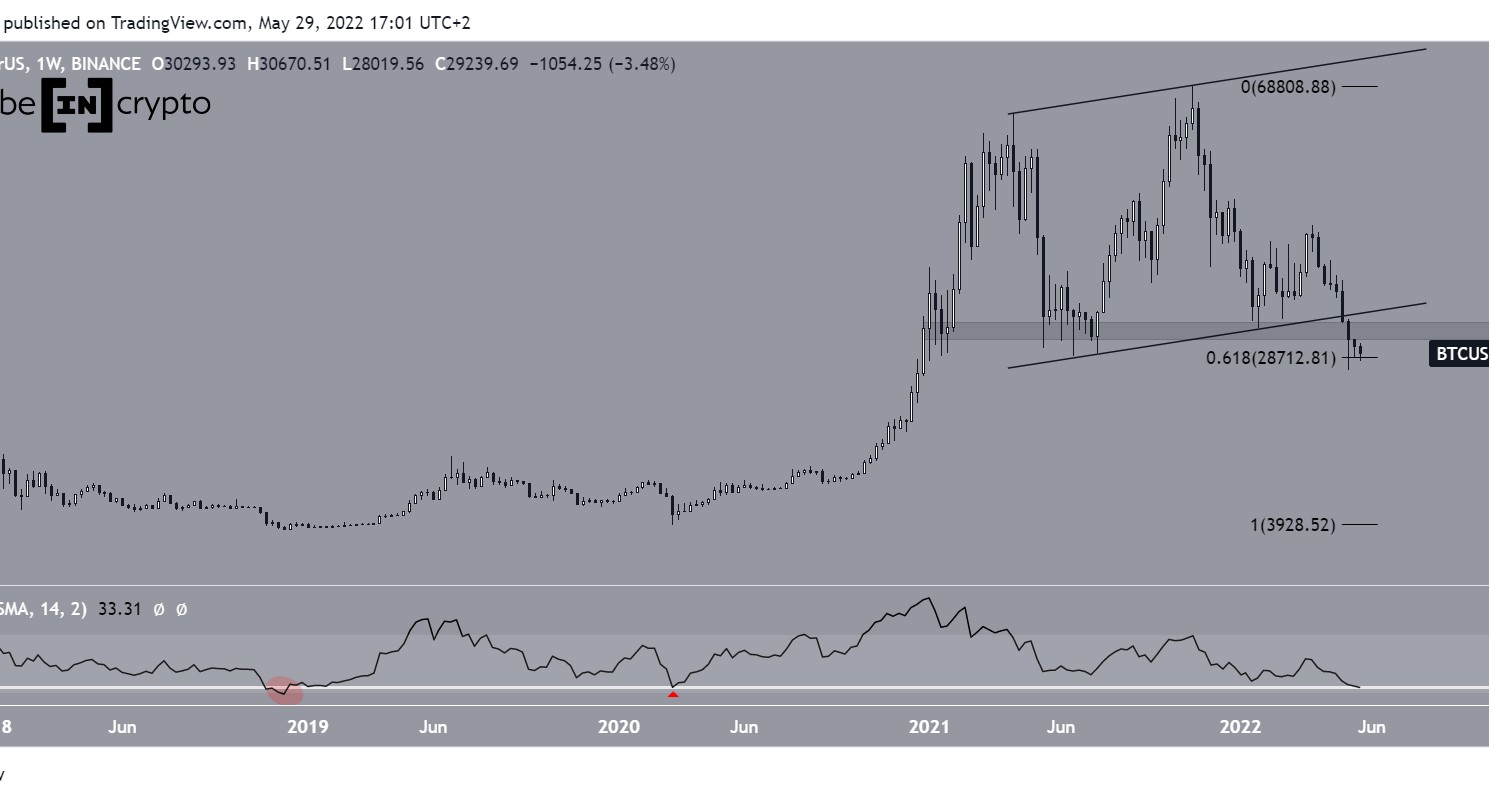
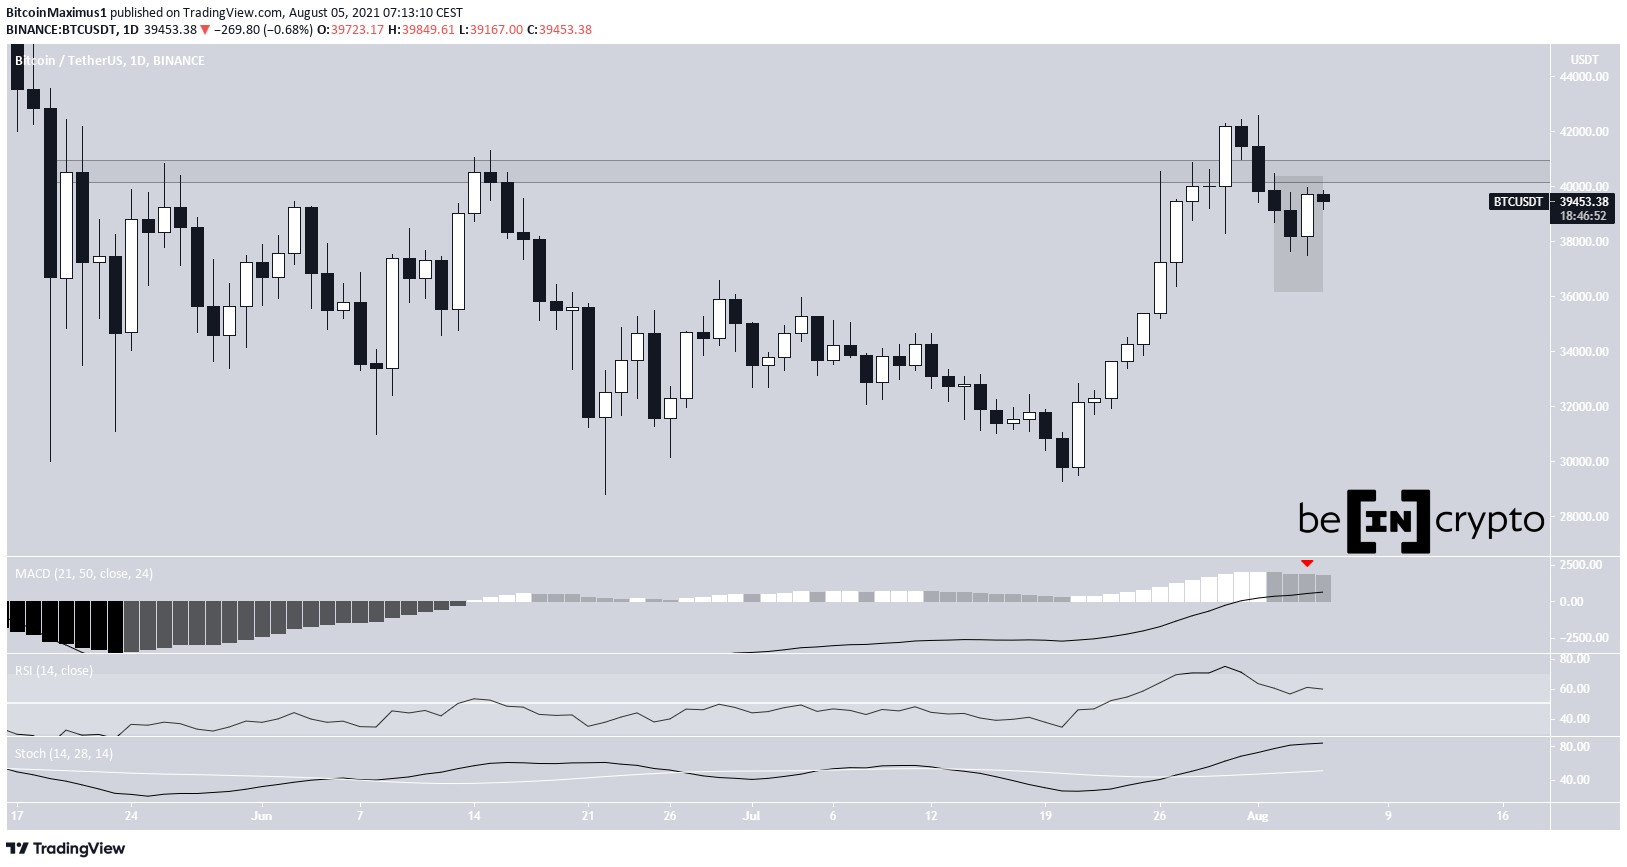
BTC/USD Chart By TradingViewAs for the long-term count, it is still possible that the price is at the bottom of wave four (white) of a five-wave upward movement. It has bounced at the:
0.382 Fib retracement support levelResistance line of the previous ascending parallel channel.However, a continued decrease below the wave one high (red line) at $13,880 would invalidate this particular wave count.
BTC/USD Chart By TradingViewFor Be[in]Crypto’s previous bitcoin (BTC) analysis, click here
The post Bitcoin (BTC) Creates Bullish Hammer Candlestick appeared first on BeInCrypto.
origin »Bitcoin price in Telegram @btc_price_every_hour
Bitcoin (BTC) на Currencies.ru
|
|