2022-8-15 12:00 |
Bitcoin (BTC) is showing bullish reversal signs in the weekly time frame but is still trading inside a corrective short-term pattern.
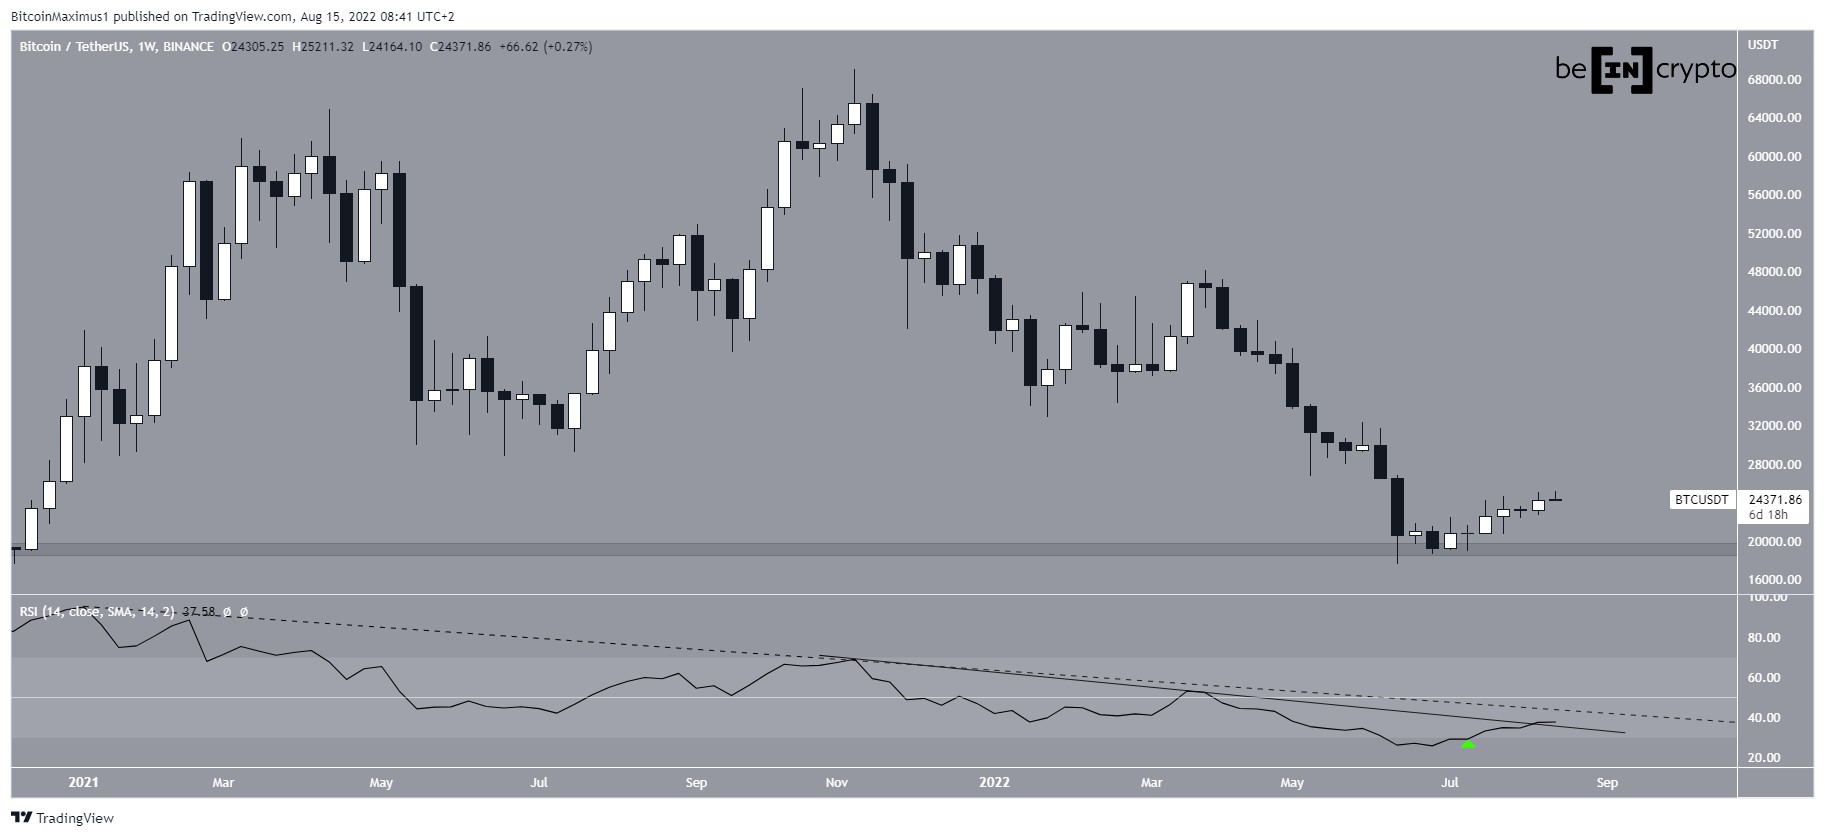
BTC has been falling since reaching an all-time high price of $69,000 in Nov. The downward movement led to a low of $17,622 in June. Since then, Bitcoin has been moving upwards and reached a high of $25,211 on Aug 15.
The low served to validate the $19,300 horizontal area as support.
An interesting development is happening in the weekly RSI, which has now moved outside its oversold territory (green icon). Moreover, it seems to be in the process of breaking out from a descending resistance line (solid) which has been in place since Nov.
There is another descending resistance line (dashed), which has been in place since the beginning of 2021. An RSI breakout above it and reclaim of the 50 line would confirm that a bullish reversal has begun.
BTC/USDT Chart By TradingView BTC breaks outThe daily chart shows that BTC has broken out from a descending resistance line (dashed) that had been in place since April. Breakouts from such long-term structures usually indicate that a long-term upward movement has begun.
However, Bitcoin has failed to initiate a significant upward movement and has yet to even reach the 0.382 Fib retracement resistance level at $29,370.
Despite this, the possibility for a bullish structure still remains intact, since the daily RSI is following an ascending support line (green) and so is the price (black). The bullish structure remains intact as long as the line is in place.
BTC/USDT Chart By TradingViewHowever, the six-hour chart shows that BTC has been increasing inside an ascending parallel channel since June 18. So far, it has made three unsuccessful attempts at breaking out (red icons), the most recent on Aug. 15.
Parallel channels usually contain corrective movements, meaning that an eventual breakdown would be expected.
Therefore, whether BTC breaks out from this channel or falls below its midline will likely determine the direction of the future trend.
BTC/USDT Chart By TradingView Wave count analysisThe main wave count indicates that BTC is likely in wave three of a five-wave upward move (black). The sub-wave count is shown in yellow, and also suggests that the price is in wave three.
So, this seems to be a 1-2/1-2 wave formation. If correct, it would mean that the upward move will accelerate in the near future.
In order for the count to remain correct, Bitcoin has to hold on above the slope of the original 1-2 and break out from its ascending resistance line (black).
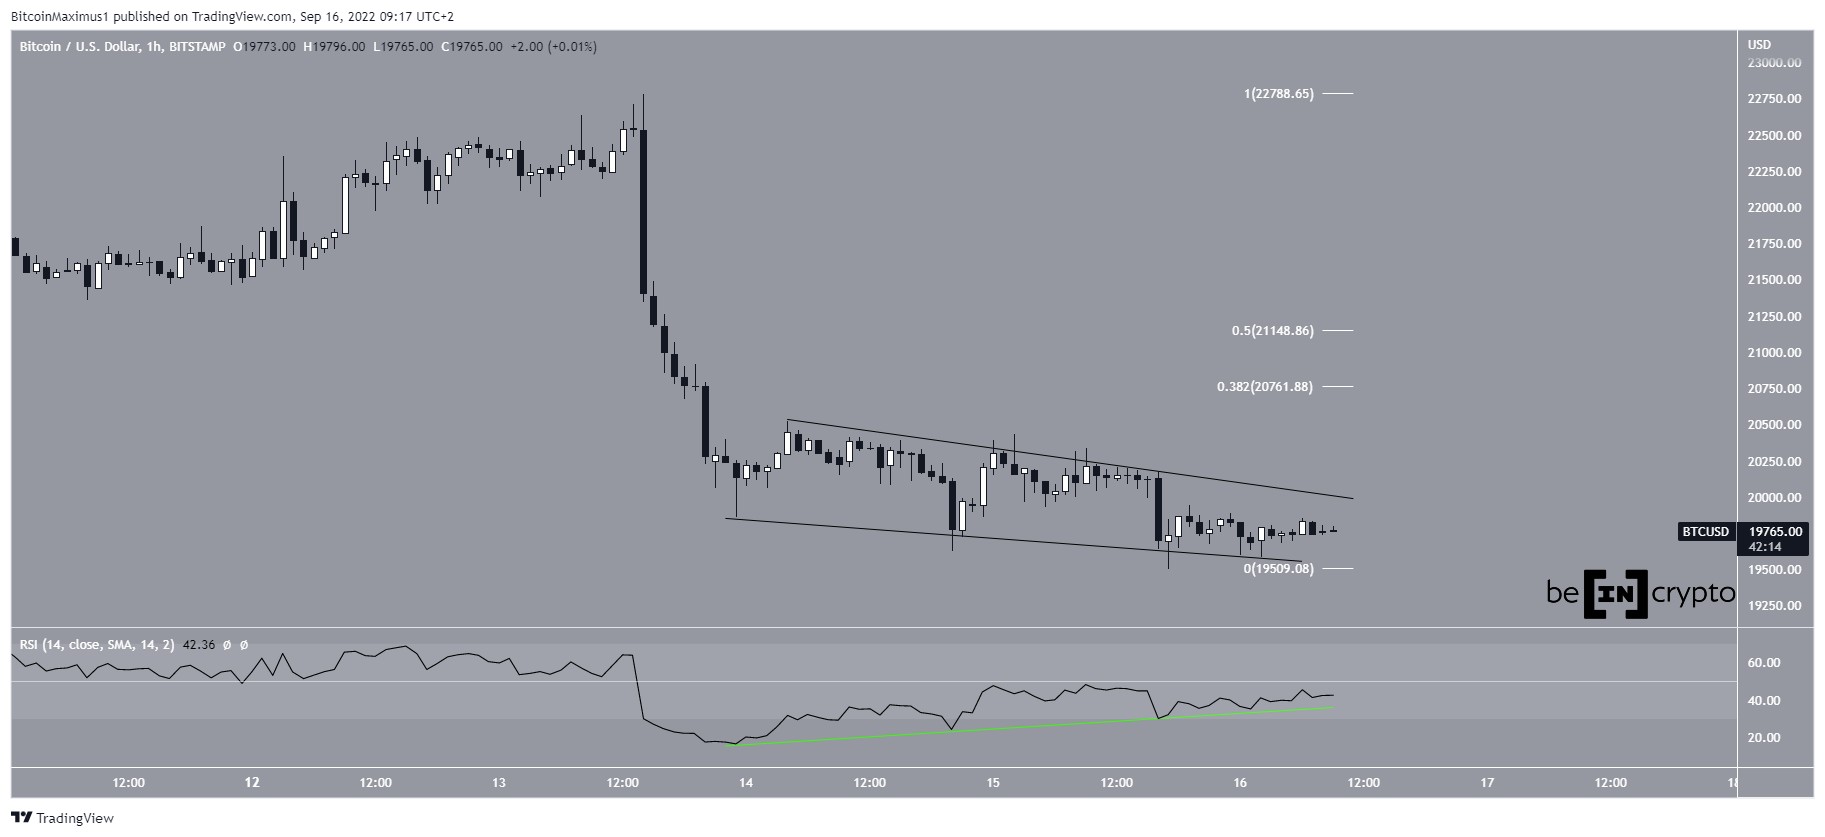
BTC/USD Chart By TradingViewThe alternative short-term count suggests that the entire upward movement since June 18 is part of a leading diagonal, hence the shape of the ascending wedge. In this case, a decrease towards the 0.5-0.618 Fib retracement support levels at $20,500 to $21,400 would be expected prior to the continuation of the upward movement.
In any case, both the short-term counts and the most likely long-term wave count suggest that the bottom is in.
BTC/USD Chart By TradingViewFor Be[in]Crypto’s previous Bitcoin (BTC) analysis, click here
The post Bitcoin (BTC) Retraces After Briefly Breaking $25,000 appeared first on BeInCrypto.
origin »Bitcoin price in Telegram @btc_price_every_hour
Bitcoin (BTC) на Currencies.ru
|
|