2021-8-5 13:48 |
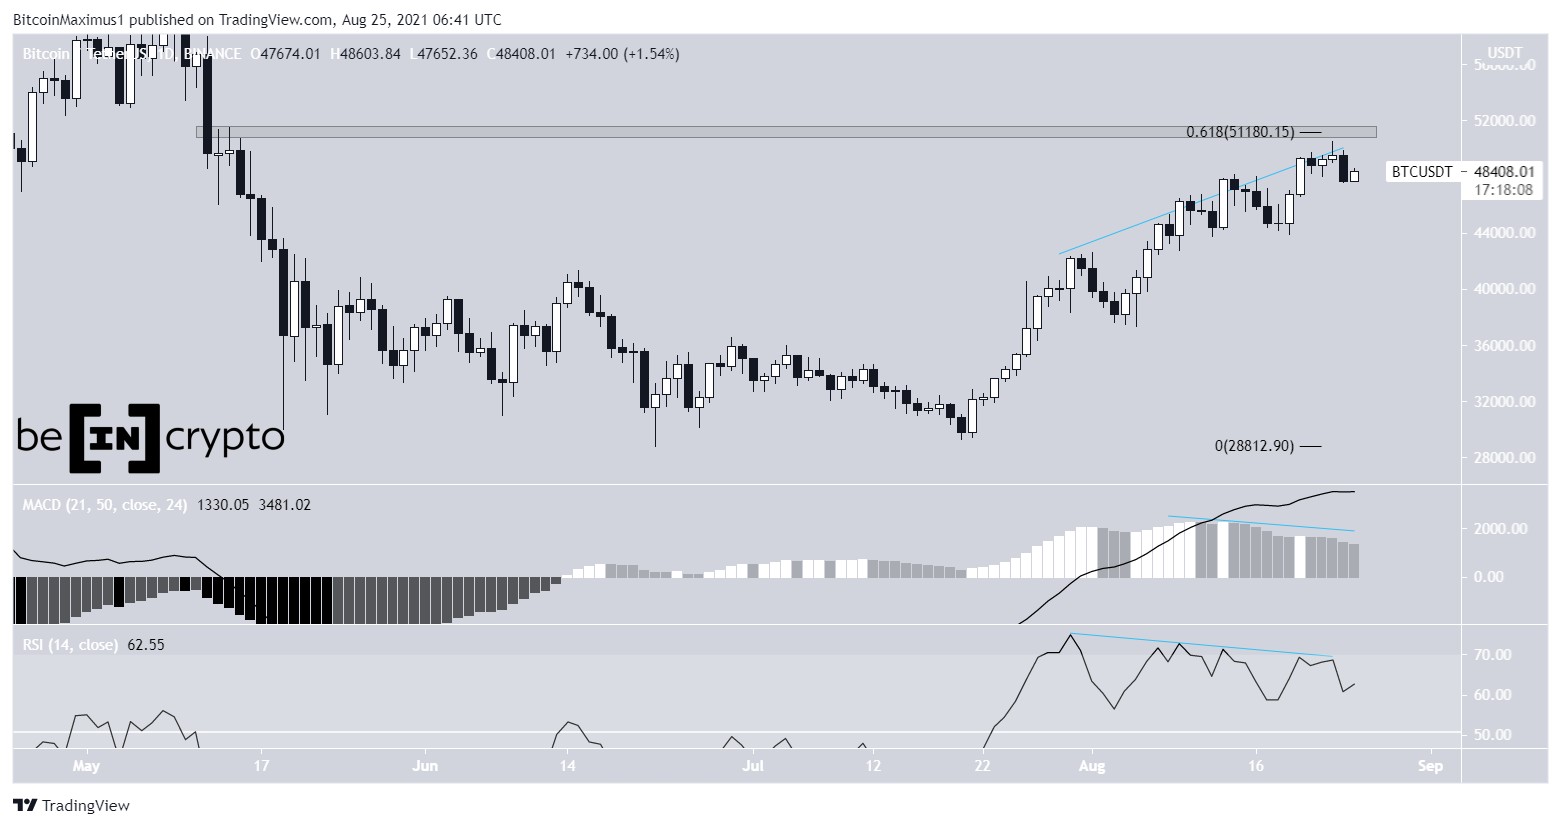
Bitcoin (BTC) has created a bullish engulfing candlestick and is making an attempt at reclaiming the $40,550 range high.
Ethereum (ETH) has broken out from an ascending parallel channel and is attempting to move above the $2,860 resistance area.
XRP (XRP) has been rejected by the resistance line of an ascending parallel channel.
Zcash (ZEC) has broken out from a descending resistance line.
Synthetix (SNX) is in the process of breaking out from the $10.30 horizontal resistance area.
Aave (AAVE) has reclaimed the $310 horizontal resistance area.
BitTorrent (BTT) has completed a double bottom pattern.
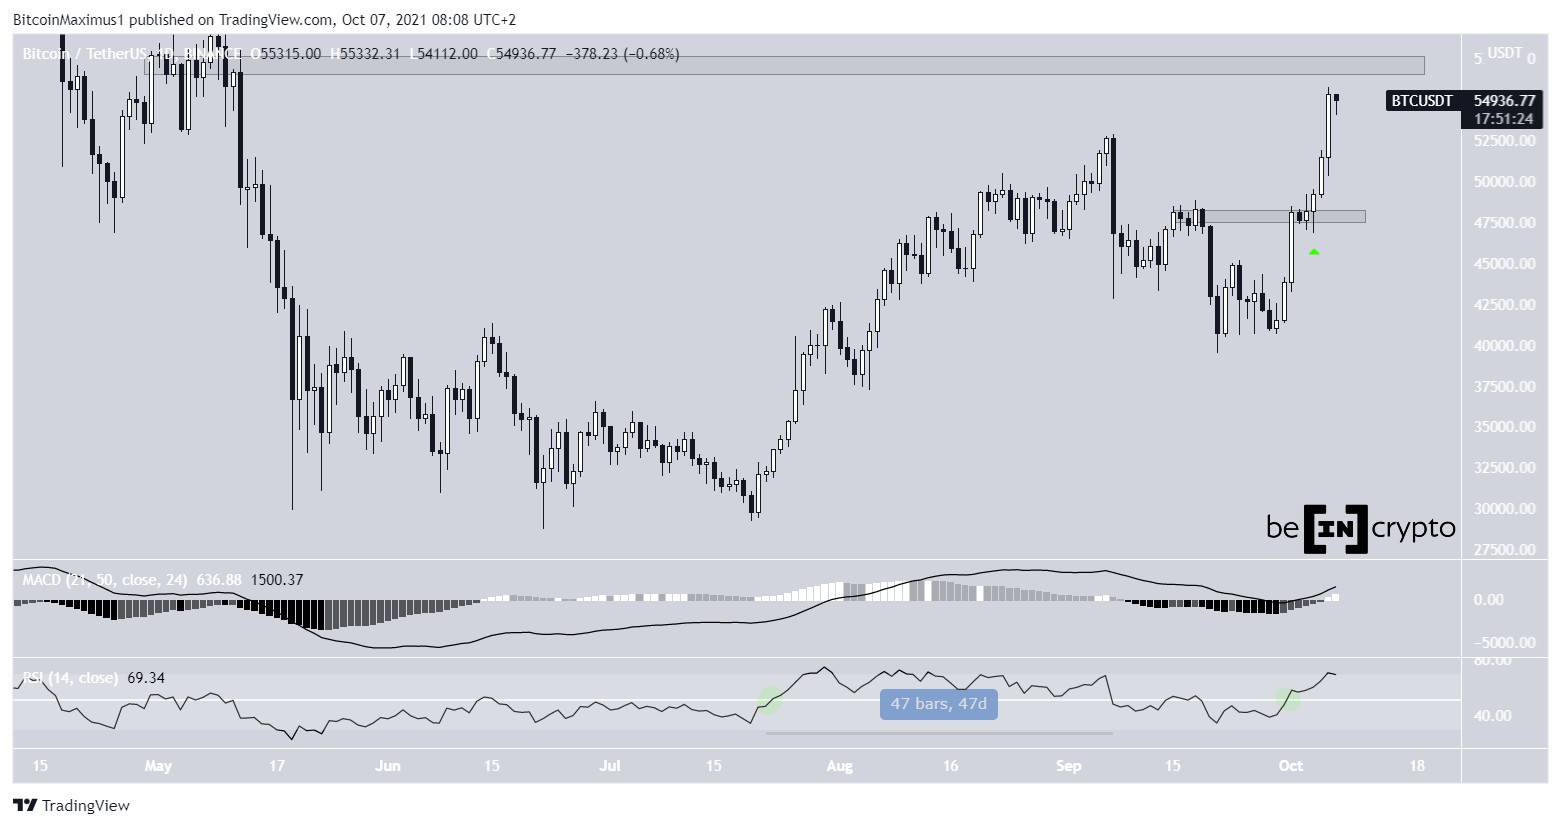
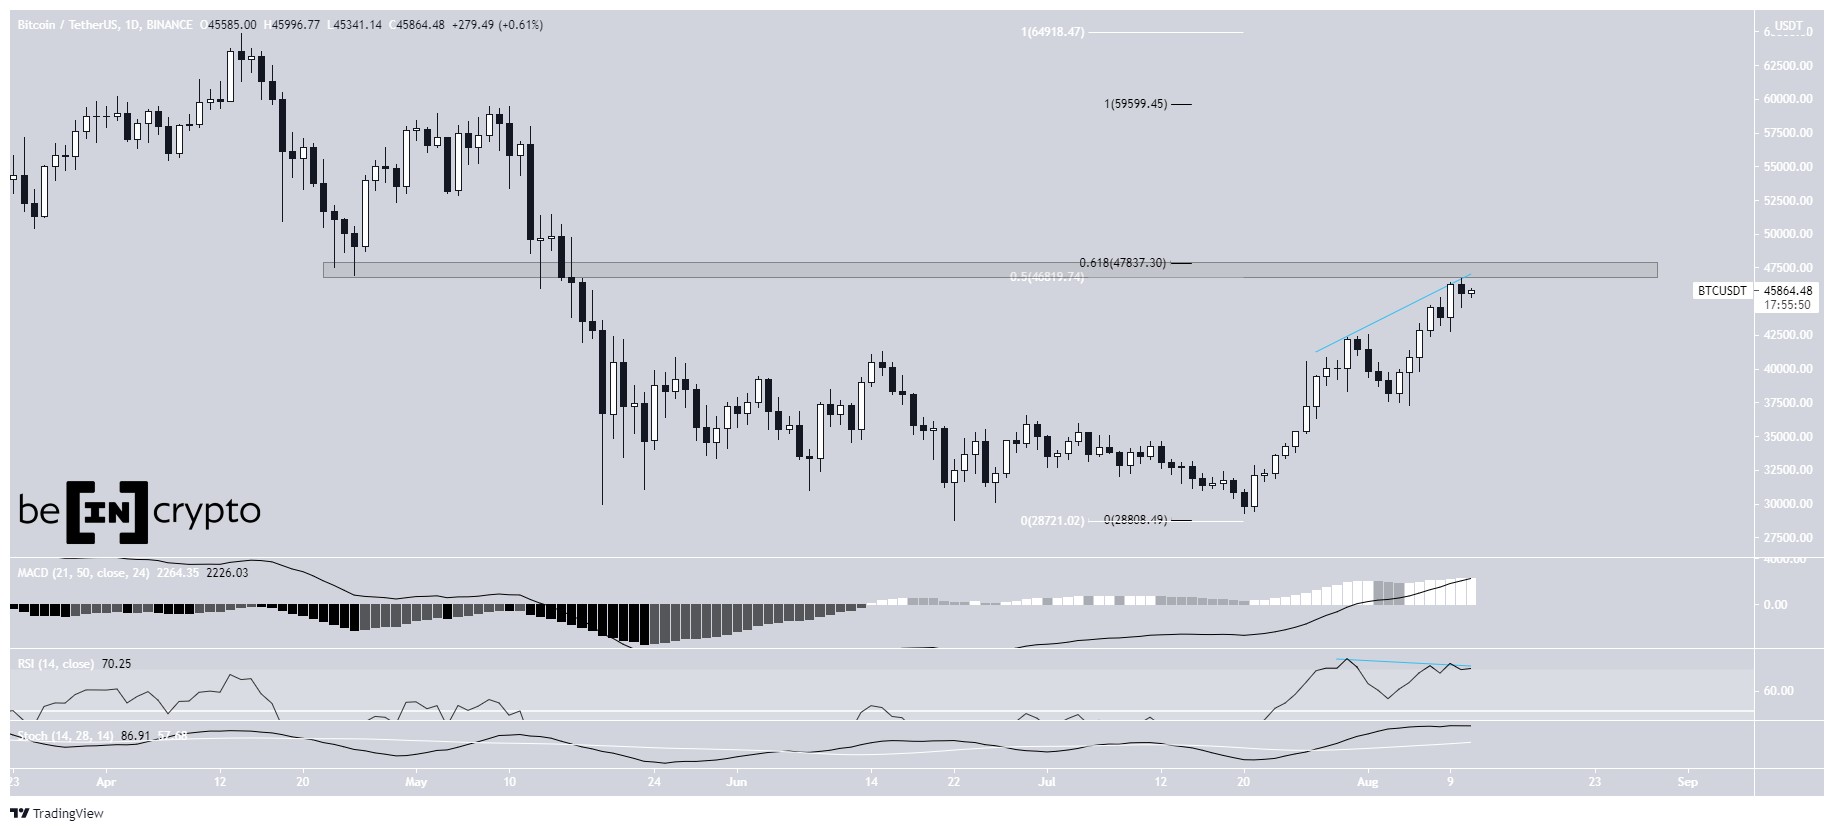
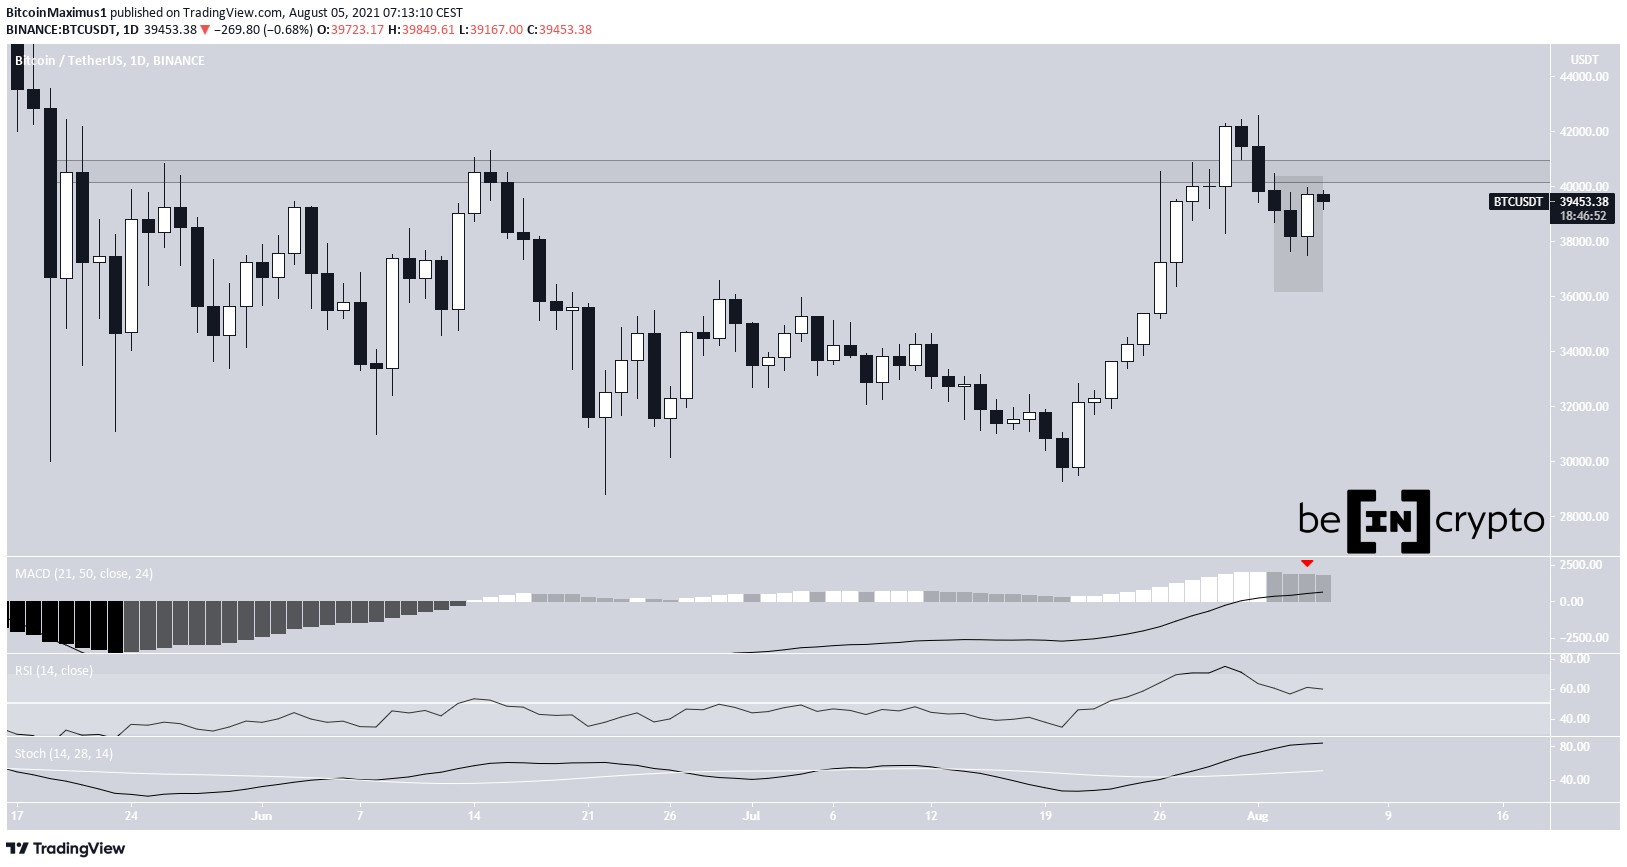
BTCBTC has been moving downwards since Aug 1, when it reached a local high of $42,599. So far, it has reached a low of $37,481 on Aug 4.
However, BTC bounced once it reached the low and created a bullish engulfing candlestick the same day.
Despite this, it’s still facing resistance from the $40,550 area, which has been in place since May, with the exception of the Aug 1 deviation.
In addition to this, the MACD is decreasing and the RSI has moved below 70 (red icons).
BTC Chart By TradingView ETHETH has been moving upwards at an accelerated rate since July 20, and broke out from an ascending parallel channel on July 31.
On Aug 4, it validated the resistance line of the channel as support and created a bullish engulfing candlestick the next day.
Technical indicators in the daily time frame are bullish, but there is a potential bearish divergence in place in the RSI.
In addition to this, ETH is approaching a strong resistance level at $2,860. The level is a horizontal resistance area and if the entire movement is an A-B-C corrective structure, a high of $2,860 would give waves A:C a 1:1.61 ratio. This would also be a Fib resistance level.
ETH Chart By TradingView XRPSince June 22, XRP has been increasing inside an ascending parallel channel. It managed to reach a high of $0.77, but was rejected by both the $0.78 horizontal resistance area and the resistance line of the channel (red icon).
It’s currently trading inside the channel again.
The main support area is found at $0.65. This is both a horizontal support area and the midline of the parallel channel.
XRP Chart By TradingView ZECZEC has been decreasing alongside a descending resistance line since May 20. On July 20, it reached a low of $83.02, seemingly breaking down below the $100 horizontal support area.
However, it began an upward move shortly after and broke out above the line while reclaiming the aforementioned support area in the process.
It still has yet to initiate a significant upward move and has been rejected by the 0.382 Fib retracement resistance level at $125.
ZEC Chart By TradingView SNXSNX has been decreasing since reaching a high of $13.65 on July 12 after completing what looks like a five-wave bullish impulse.
The downward move that followed led to a low of $7.14 on July 21. The low was made right at the 0.786 Fib retracement support area of $7.30.
SNX has been increasing since then and is currently attempting to break out from the $10.30 horizontal resistance area. Doing so would likely lead to a retest of the $13.70 highs once again.
SNX Chart By TradingView AAVEAAVE has been increasing since breaking out from a descending resistance line on June 30.
While it was initially rejected by the $310 resistance area (red icon), it managed to create a higher low on July 20 and finally broke out above the area on Aug 1.
It validated the area as support after two days and is currently increasing toward the next closest resistance level at $416.
AAVE Chart By TradingView BTTOn June 22 and July 22, BTT created a double bottom pattern at $0.019. The pattern was combined with bullish divergences in both the RSI and MACD.
After completing the pattern, BTT initiated an upward move above the $0.003 resistance area on Aug 3.
The next closest resistance level is found at $0.0046.
BTT Chart By TradingViewFor BeInCrypto’s latest bitcoin (BTC) analysis, click here.
The post BTC, ETH, XRP, ZEC, SNX, AAVE, BTT — Technical Analysis Aug 5 appeared first on BeInCrypto.
origin »Bitcoin price in Telegram @btc_price_every_hour
Bitcoin (BTC) на Currencies.ru
|
|