BTC, ETH, XRP, NEAR, XMR, COCOS, CHR — Technical Analysis Sept 3

BTC, ETH, XRP, NEAR, XMR, COCOS, CHR — Technical Analysis Sept 3
фото показано с : beincrypto.com

2021-9-3 13:33

Bitcoin (BTC) has broken out from a descending parallel channel.

Ethereum (ETH) and XRP (XRP) are in wave five of their respective bullish impulses.

Near Protocol (NEAR) has broken out from a descending resistance line.

Monero (XMR) is following an ascending support line.

Cocos-BCX (COCOS) is trading inside a descending parallel channel.

Chromia (CHR) is trading inside an ascending wedge.
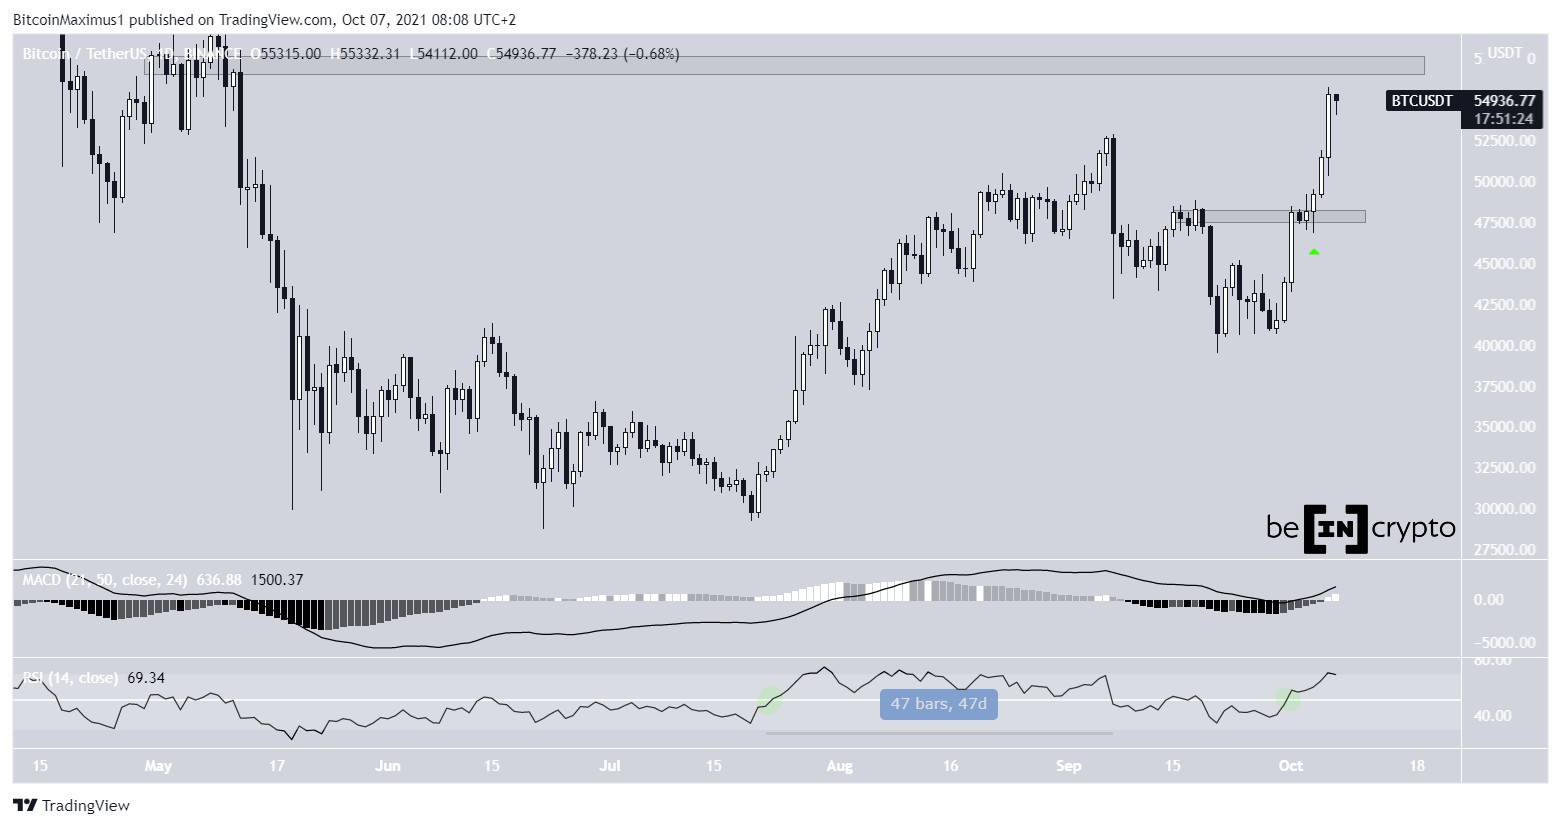
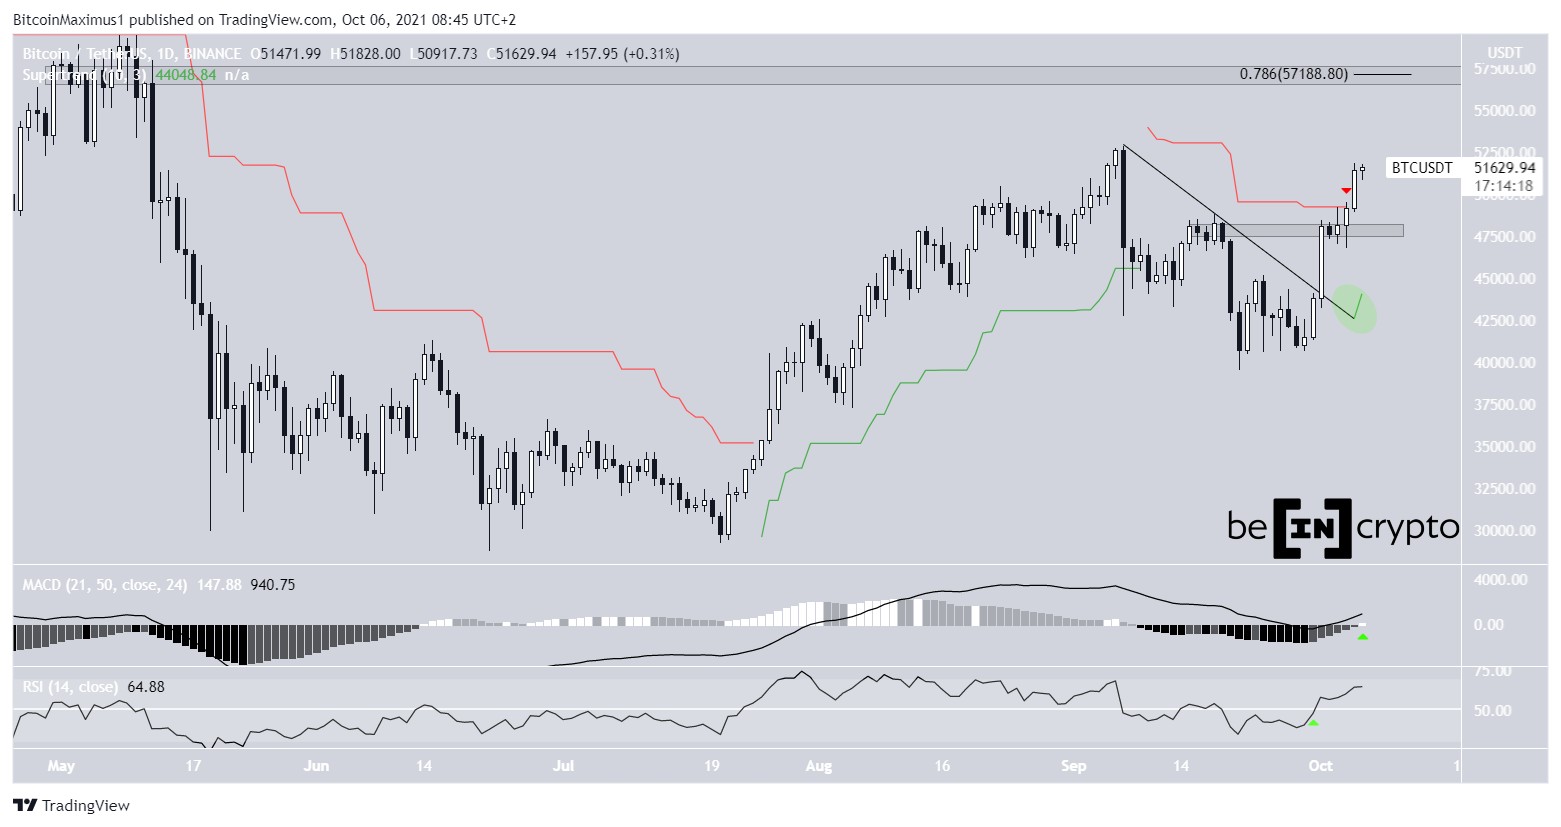
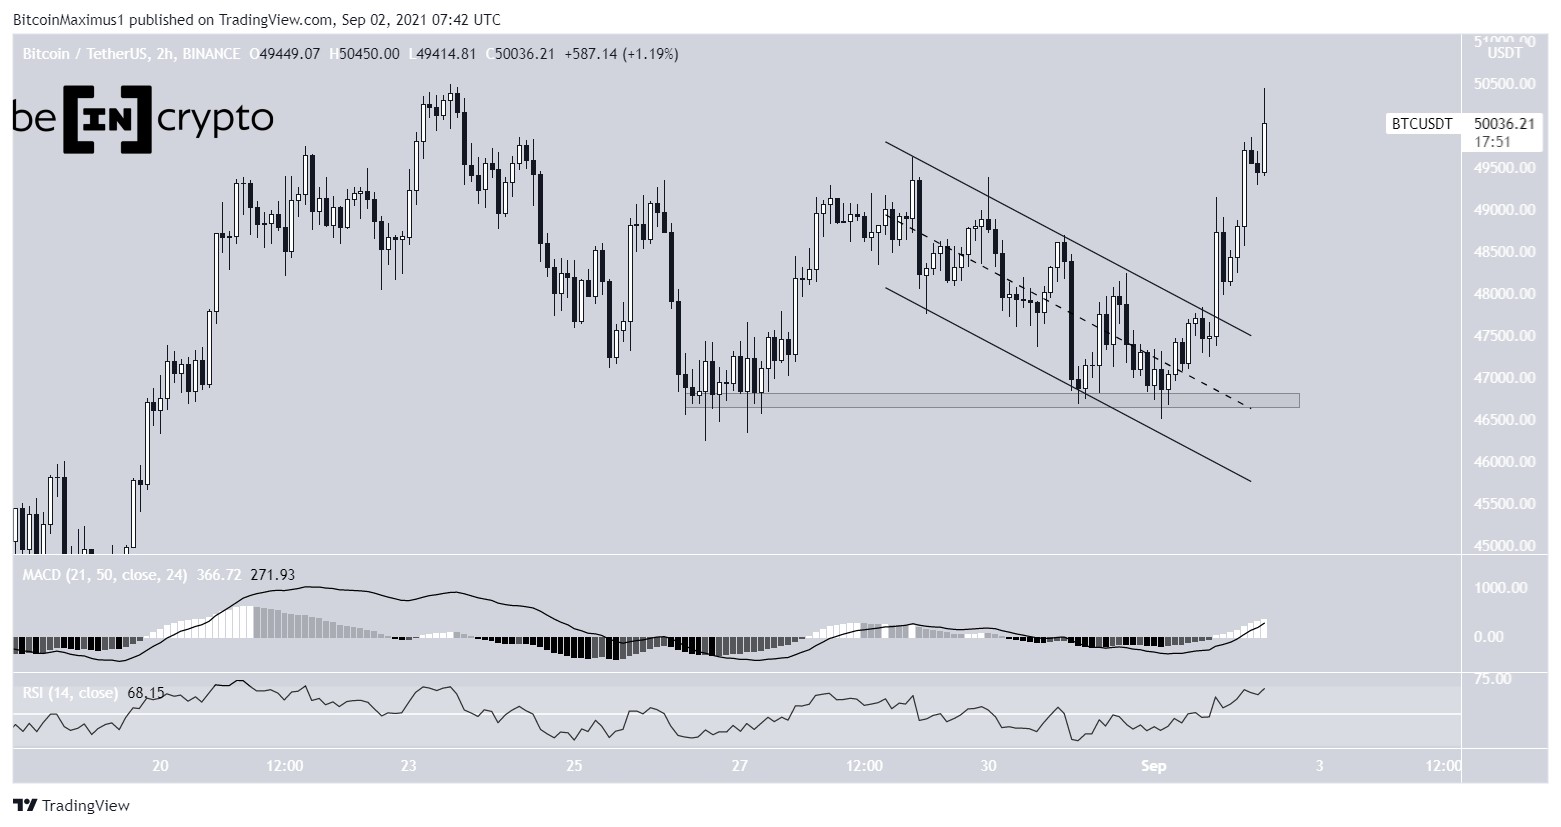
BTC

BTC had been decreasing inside a descending parallel channel since Aug 29. Such channels usually contain corrective structures. 

It bounced at the $46,800 horizontal support area on Sept 1 and broke out later that day. Both the MACD and RSI are bullish, giving validity to the breakout. 

However, BTC is still trading below the $51,200 horizontal resistance area.

BTC Chart By TradingView ETH

ETH has been increasing since July 20. While the rally stalled between Aug 13 and Aug 31, ETH broke out on the latter date and has been moving upwards since.

So far, it has reached a high of $3,956 on Sept 3.

It seems that ETH is in wave five of a bullish impulse. Furthermore, it’s trading at a confluence of Fib targets, given by the: 

0.786 Fib retracement resistance level (white)Length of wave one (black)0.382 length of waves 1-3 (orange). 

If ETH continues upwards, the next resistance would likely be found between $4,150-$4,254.

ETH Chart By TradingView XRP

XRP has been moving upwards since July 20. On Aug 13, it broke out above the $1.05 horizontal area before validating it as support. 

It consolidated inside a symmetrical triangle, which was likely the fourth wave of a bullish impulse.

A potential target for the top of the entire upward move is $1.65. The target is found using the 0.618 length of waves 1-3. In addition to this, it coincides with a horizontal resistance area.

XRP Chart By TradingView NEAR

NEAR has been following a descending resistance line since March 13. On Aug 18, it managed to break out and reached a high of $6.59 four days later. 

However, it was rejected by the $6.60 horizontal resistance area. 

The rejection caused it to validate both the $4.66 horizontal support area and the previous resistance line as support. 

However, technical indicators are relatively neutral. While the MACD is losing strength, it’s still positive and the RSI is above 50. Furthermore, the supertrend is bullish.

NEAR Chart By TradingView XMR

XMR has been following an ascending support line since July 20. After breaking out from the $283 horizontal resistance area, it returned in order to validate it as support on Aug 31 (green icon). The touch of the area also coincided with the ascending support line. 

XMR has been moving upwards since. The increase is supported by the bullish MACD and RSI. The next closest resistance area is found at $390. This target is the 0.618 Fib retracement resistance level.

XMR Chart By TradingView COCOS

Similar to BTC prior to its breakout, COCOS is trading inside a descending parallel channel. It has been doing so since it was rejected by the $0.88 resistance area on Aug 9. 

It is currently trading in the upper portion of the channel and is rapidly approaching the resistance line. 

The MACD and RSI both support the possibility of a breakout. 

If COCOS manages to break out from both the channel and the $0.88 area, the next resistance would be found at $1.42. 

COCOS Chart By TradingView CHR

CHR has been increasing since July 8. However, it’s trading inside an ascending wedge formation, which is normally considered a bearish pattern. 

In addition to this, the resistance line of the wedge coincides with the $0.60 horizontal resistance area.

Therefore, while CHR could increase and reach this resistance, a breakout at the current time seems unlikely.

CHR Chart By TradingView

For BeInCrypto’s latest Bitcoin (BTC) analysis, click here.

The post BTC, ETH, XRP, NEAR, XMR, COCOS, CHR — Technical Analysis Sept 3 appeared first on BeInCrypto.

Similar to Notcoin - Blum - Airdrops In 2024

origin »

Bitcoin (BTC) на Currencies.ru

$ 68347.26 (+0.01%)
Объем 24H $27.555b
Изменеия 24h: 0.90 %, 7d: 1.64 %
Cегодня L: $68231.03 - H: $68598.46
Капитализация $1346.844b Rank 1
Цена в час новости $ 50668.56 (34.89%)

btc analysis sept chr technical cocos xrp

btc analysis → Результатов: 126


This Analysis Suggests Bitcoin’s Price May Plunge 50% to the $3,000s, Again

Over the past month, Bitcoin (BTC) has absolutely exploded higher. In fact, the cryptocurrency is up around 40% since the low of $6,400 put in during December of last year. While many analysts have said that this jaw-dropping rally constitutes a macro reversal that will thrust BTC back into a decisively bullish phase, an analysis... The post appeared first on NewsBTC.

2020-1-20 03:45


Фото:

UTXO Analysis Points to a BTC Price Bottom in Q1 2019

“When will the bear market end?” is the refrain of bored and frustrated traders across crypto Twitter. “Soon” is the answer suggested by Delphi Digital’s latest report. “Bitcoin Holder Analysis Through Cycles” seeks to determine when selling pressure that has deflated BTC prices over the past 12 months will alleviate, signaling that market recovery could […] The post UTXO Analysis Points to a BTC Price Bottom in Q1 2019 appeared first on Bitcoin News.

2019-1-12 01:10


Cryptocurrency Market Update: BTC, ETH, XRP, and BCH Price Analysis

Bitcoin BTC/USD Market From yesterday’s open at $4094 measured to the current levels of $3732.2 the price of Bitcoin has decreased by 8.85%. The price went further down yesterday to $3688.5 but since it interacted with the horizontal support level it started consolidating and recovering and is currently in a sideways but upward trajectory above […]

2019-1-11 22:32


Bitcoin Price Analysis: BTC bulls Raved, $4,500 Defining

Latest Bitcoin News By dropping 8,540.4082 BTC, the number of Bitcoin open short positions at BitFinex is down 26 percent at the time of press in the last two days. This decline hint of capital flight and as a major player in the space, a downtime that would see the exchange move their servers from […] The post Bitcoin Price Analysis: BTC bulls Raved, $4,500 Defining appeared first on Ethereum World News.

2019-1-8 15:30


Bitcoin Price Analysis: BTC bulls Raved, BitFinex Server Migration in Progress

Latest Bitcoin News By dropping 8,540.4082 BTC, the number of Bitcoin open short positions at BitFinex is down 26 percent at the time of press in the last two days. This decline hint of capital flight and as a major player in the space, a downtime that would see the exchange move their servers from […] The post Bitcoin Price Analysis: BTC bulls Raved, BitFinex Server Migration in Progress appeared first on Ethereum World News.

2019-1-7 15:30


Фото:

Bitcoin Price Analysis: Range-Bound Market Coiled for Next Move

For the better part of a month and a half, bitcoin has been fairly range-bound and unable to establish new lows or new highs. There are some bullish and bearish setups on the horizon for bitcoin, so let’s check out both sides of the argument because currently the market is sitting in the middle of Indecisionville — the most immediate sign of which is this glaringly obvious head-and-shoulders bottom reversal pattern:Figure 1: BTC-USD, Daily Candles, Head-and-Shoulders BottomThis current pattern is nothing more than a setup at the moment, but it represents one potential outcome of this sustained consolidation.

2019-1-4 02:22


Bitcoin Price Analysis: BTC/USD Ready for $4,000, HitBTC Insolvent or “Coin” Run?

Latest Bitcoin News For novices, the slogan is simple: Not your keys, not your coins. And I mean private keys. You lose it and there goes your coins. They won’t be recovered and will hang in the digital ether forever—unless of course the Bitcoin developer community decide to do something about it —perhaps go the […] The post Bitcoin Price Analysis: BTC/USD Ready for $4,000, HitBTC Insolvent or “Coin” Run? appeared first on Ethereum World News.

2019-1-2 15:47