2021-10-8 18:54 |
Bitcoin (BTC) has finally moved above its September highs.
Ethereum (ETH) and XRP (XRP) are trying to move above horizontal resistance levels.
Polkadot (DOT) is increasing alongside an ascending support line.
Dash (DASH) is still following a descending resistance line.
Fantom (FTM) is close to reaching a new all-time high price.
Stellar (XLM) has moved above the $0.34 resistance area.
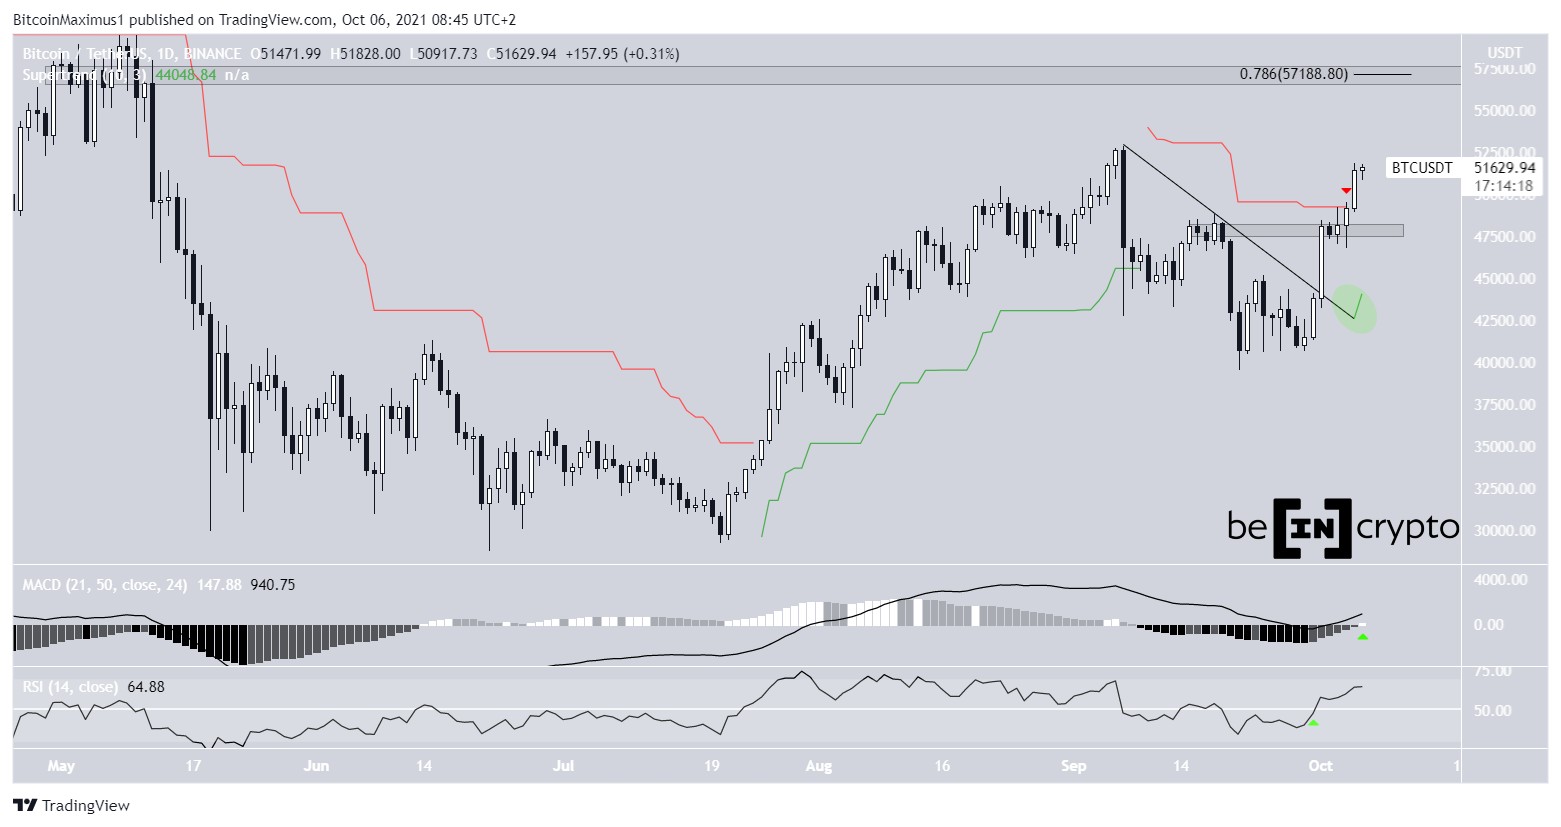
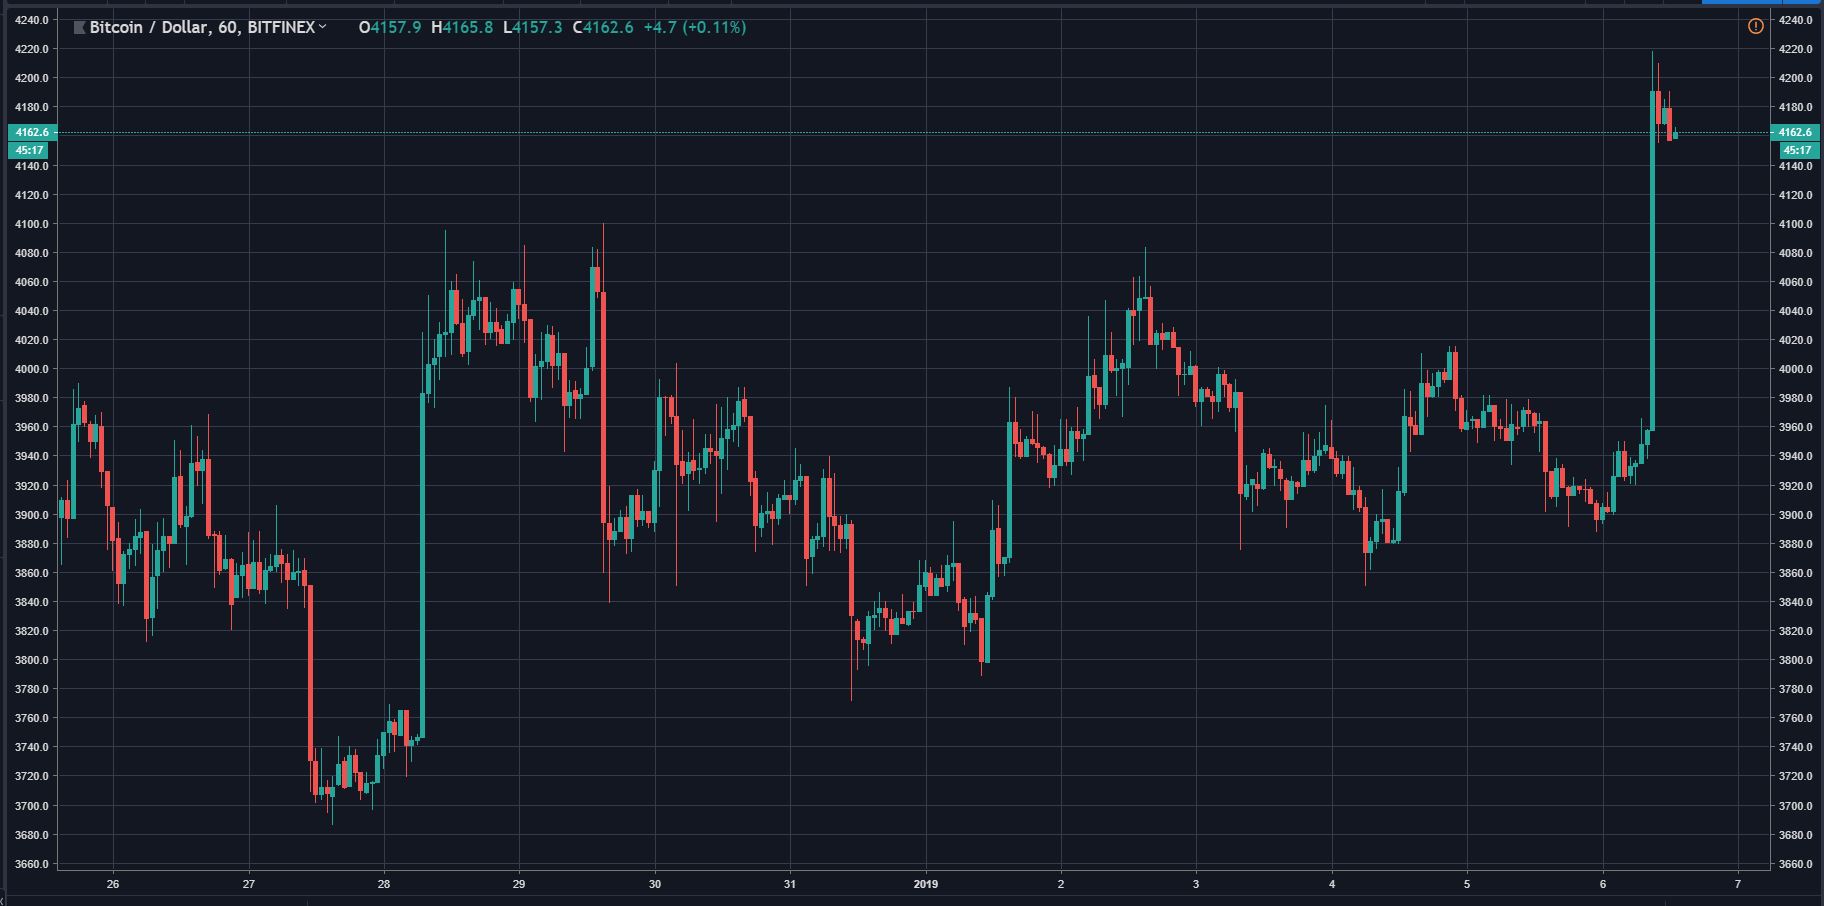
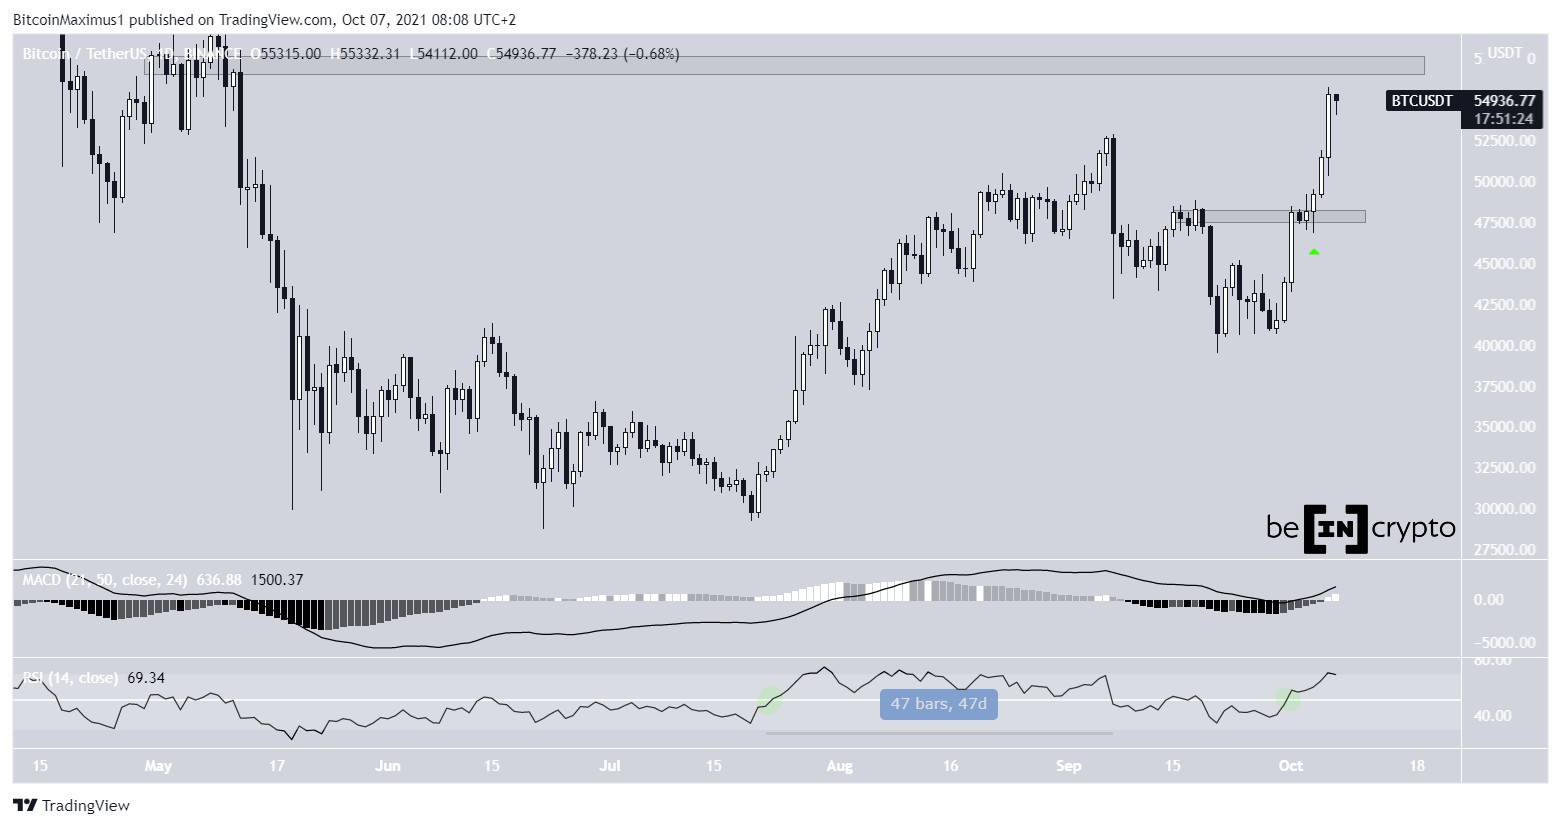
BTCOn Oct 6, BTC increased significantly by creating a bullish candlestick of more than $5,000. With this increase, BTC has moved above its Sept highs. The next resistance area is now at $57,200.
Technical indicators in the daily time-frame are bullish, supporting an upward movement towards this resistance area.
The RSI, which is a momentum indicator, has moved above 50 (green circle). Movements above the 50 line usually indicate that the trend is bullish. Previously, it did the same on Jul 21 and increase for 47-days afterwards.
Furthermore, the MACD is also bullish and increasing. The indicator uses short- and long-term moving averages (MA) in order to determine if the trend is picking up steam. Since both the histogram and the line are positive, it means that the short-term trend is faster than the long-term one and is accelerating at a faster rate.
The wave count is also bullish.
Chart By TradingView ETHETH had been decreasing alongside a descending resistance line since reaching a high on Sept 7. However, on Oct 3, it managed to break out above this line, indicating that the downward movement might have come to an end.
While the movement is similar, ETH seems to be lagging behind BTC, since the latter has already moved above the top of September highs.
Once ETH clears $3,600, it is likely to accelerate its rate of increase, similarly to what BTC is currently doing.
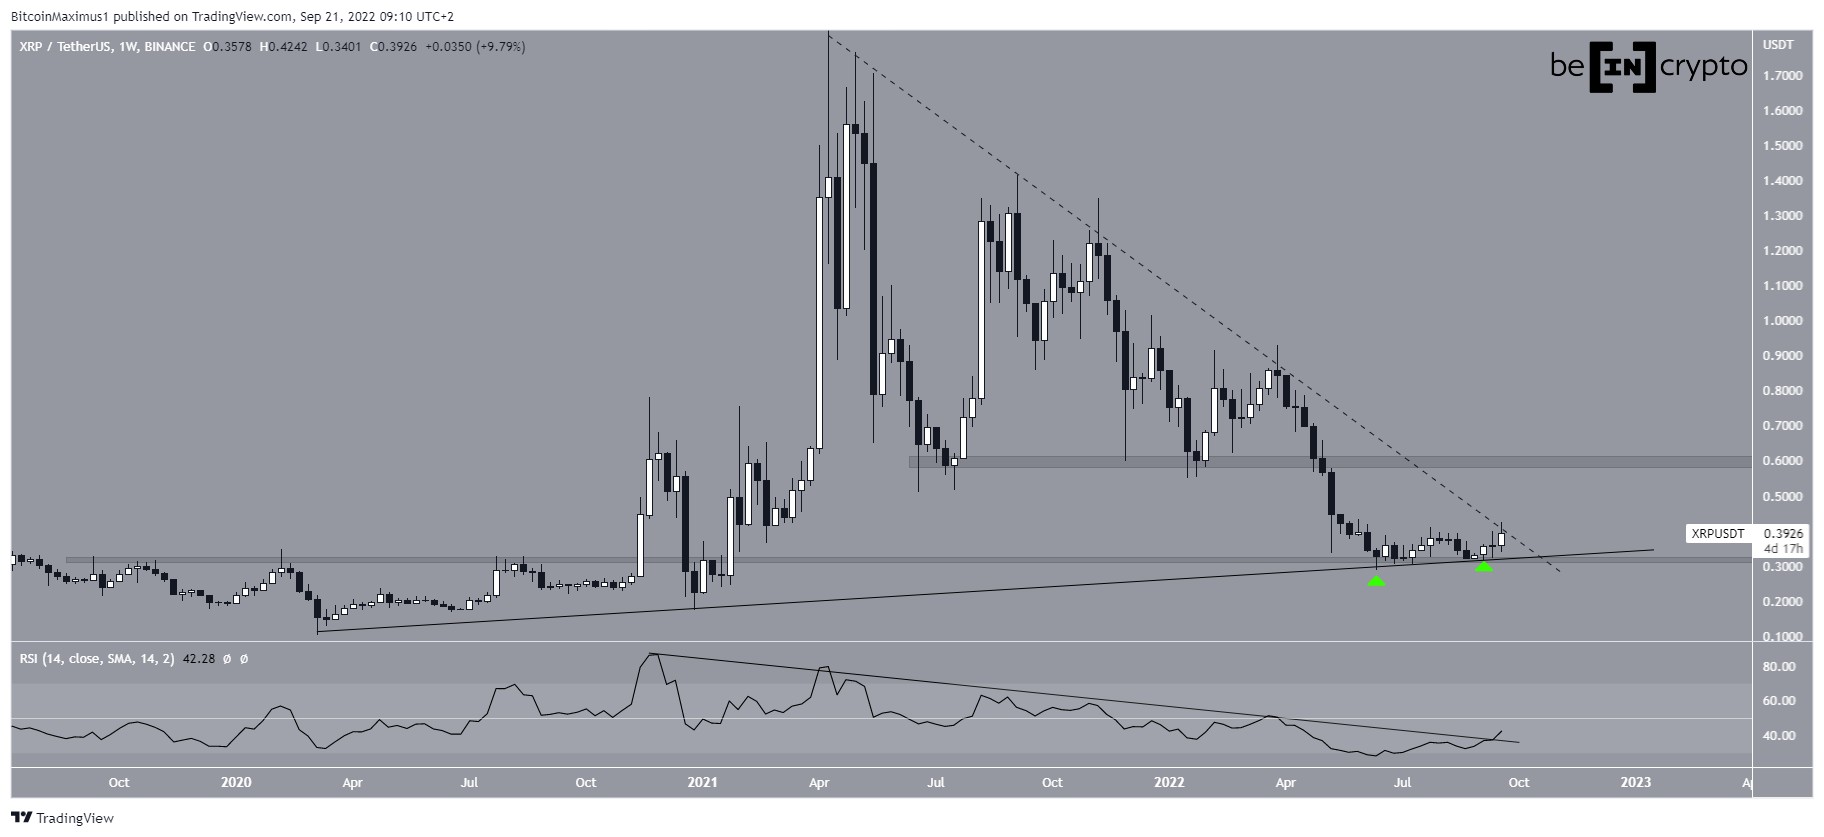
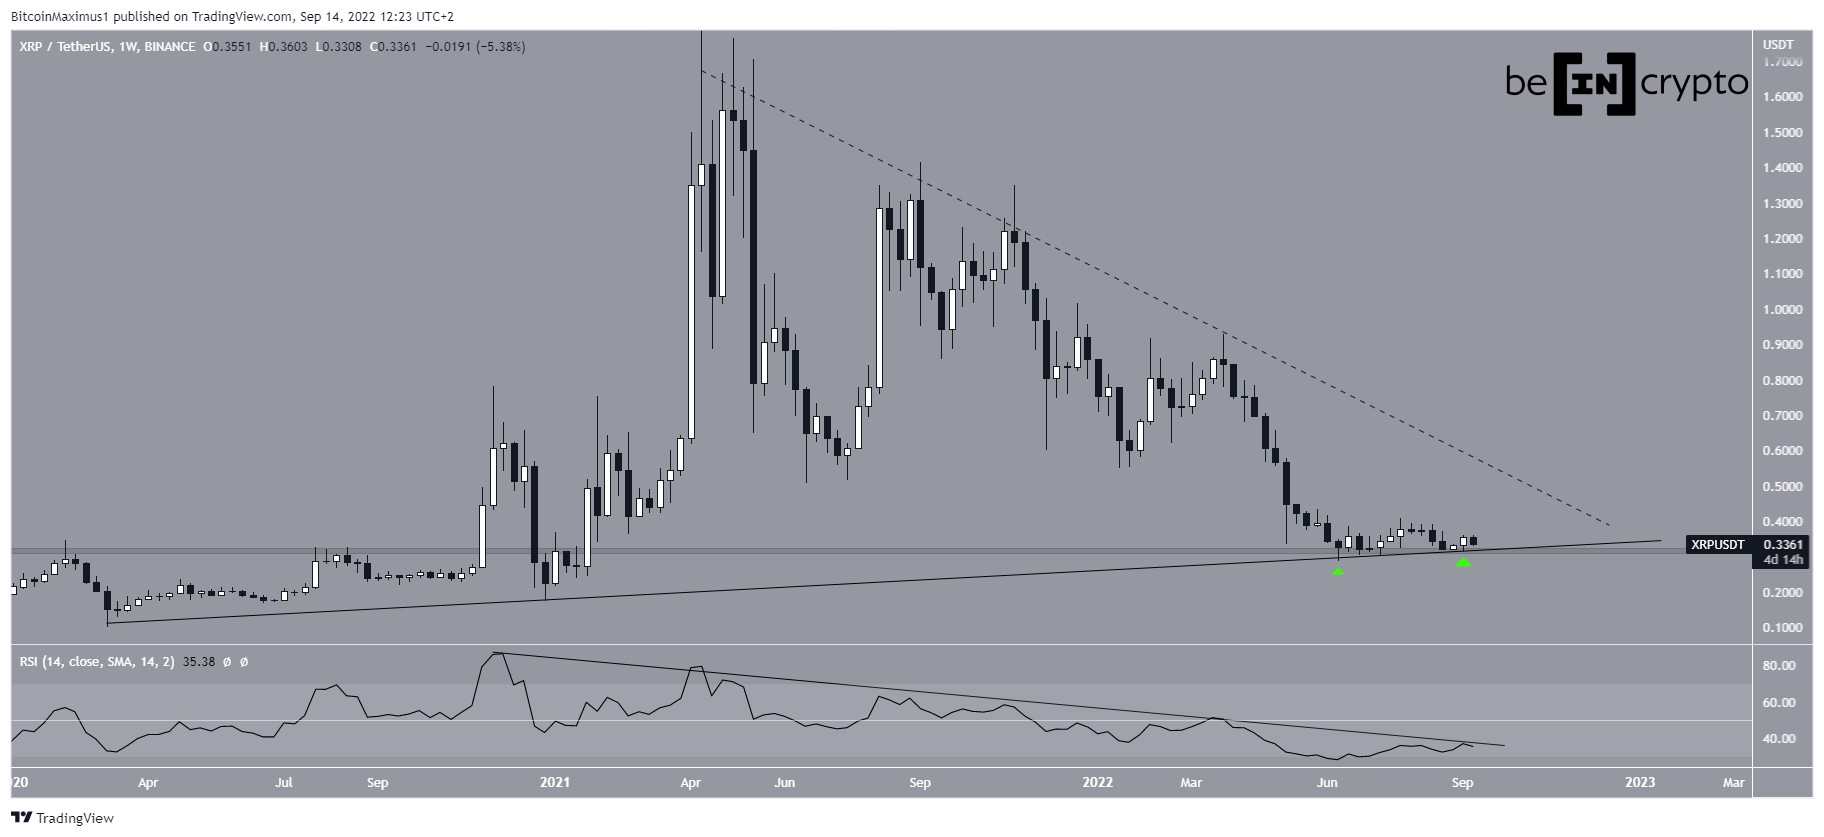
Chart By TradingView XRPXRP has been increasing inside an ascending parallel channel since Sept 22. Twice, it made an attempt at breaking out (Red circles), but fell back inside the channel afterwards.
However, it successfully broke out on Oct 6 and validated the resistance line as support the next day (green icon). This is a sign that the consolidation period has ended and XRP can now move upwards.
If it manages to break out above the $1.135 resistance area, it would likely head towards the Sept high at $1.41.
The $1.135 resistance area is the 0.5 Fib retracement resistance level and a horizontal resistance area.
Chart By TradingView DOTDOT has been moving upwards alongside an ascending support line since July 19. It has validated the line thrice (green icons) and has deviated below it once (red icon), doing so on Sept 29.
The fact that it reclaimed the line after breaking down and afterwards validated it as support increasing the significante of the trend line. Therefore, the trend remains bullish as long as DOT is trading above it.
The next closest resistance levels are at $41.35 and $49.70. A move to the former would amount to an increase of 23%, while one to the latter an increase of 48%.
Chart By TradingView DASHDASH has been following a descending resistance line since Aug 23, indicative of a downward trend. This led to a low of $146.3 on Sept 28.
While DASH has been moving upwards since, it has yet to break out above this resistance line, which is currently at $205.
A breakout above the line could cause an upward movement similar to that which transpired on July 17 (green icon).
Chart By TradingView FTMFTM has been moving upwards since Sept 21. So far, it has reached a high of $1.9, doing so on Oct 7. This is only slightly below the current all-time high price of $1.94.
However, the highest daily close so far has been at $1.65, and FTM is currently considerably above this level (red line). This shows increased buying strength, since the higher prices is being maintained. Therefore, unless a drastic decrease happens, FTM will reach its highest ever close today.
The next closest resistance levels are at $2.20 and $2.55. These are the 1.27 and 1.61 external Fib retracement resistance levels. When the price is at an all-time high, such levels are used to determine resistances.
Chart By TradingView XLMXLM has been increasing since it first broke out above a descending resistance line on Sept 30.
On Oct 6, it created a bullish candlestick and moved above the $0.34 level, which is a crucial resistance area. Its validation as support the next day (green icon) is a sign that the token is likely moving higher.
If so, the closest resistance area is at $0.425.
Chart By TradingViewFor BeInCrypto’s latest Bitcoin (BTC) analysis, click here.
What do you think about this subject? Write to us and tell us!
The post BTC, ETH, XRP, DOT, DASH, FTM, XLM – Technical Analysis Oct 7 appeared first on BeInCrypto.
origin »Bitcoin price in Telegram @btc_price_every_hour
Bitcoin (BTC) на Currencies.ru
|
|