2021-12-27 11:20 |
Bitcoin (BTC) is showing definitive signs that it has completed its correction and is moving towards the closest resistance area.
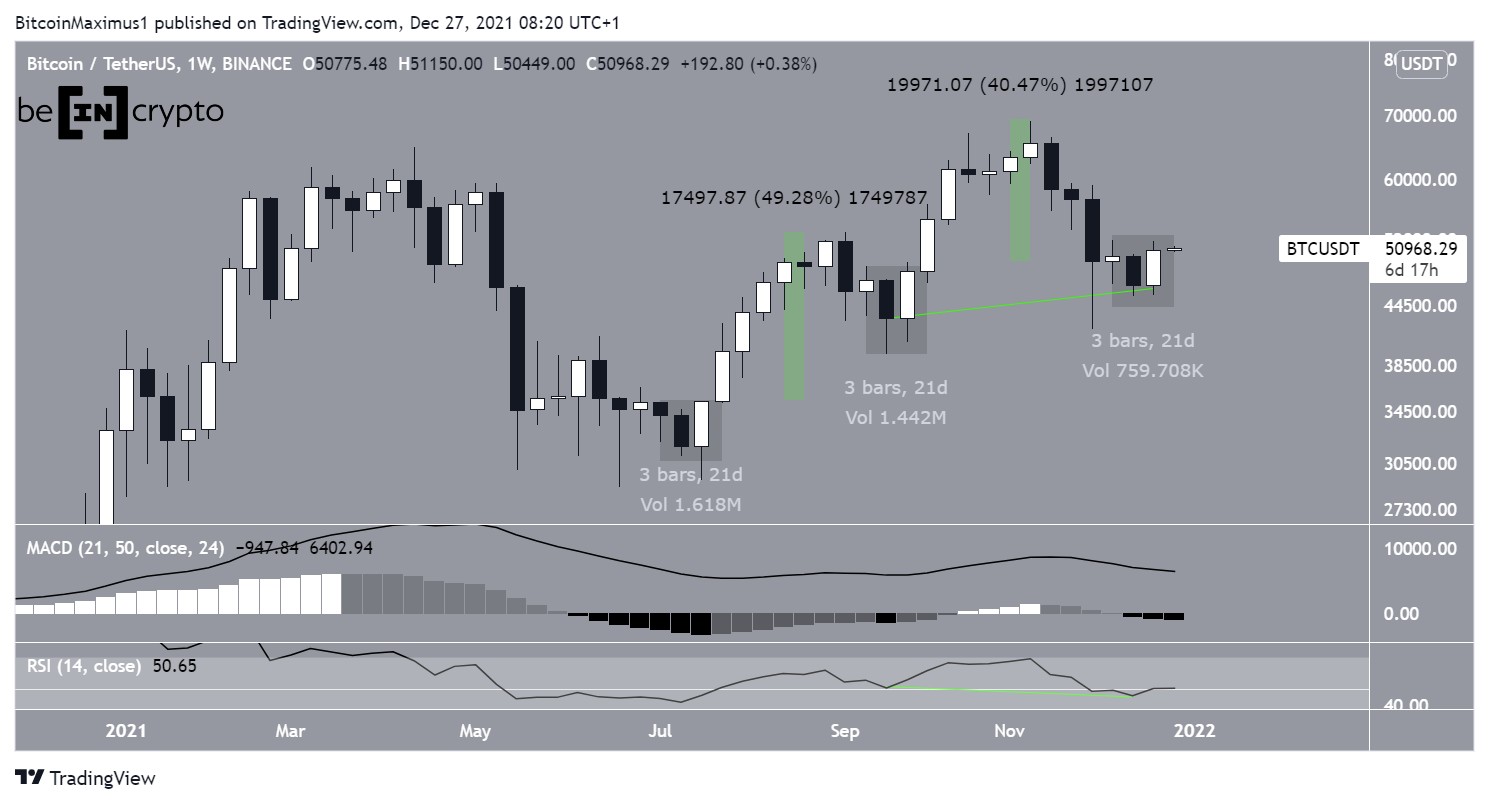
BTC increased considerably during the week of Dec 19-26, reaching a close of $50,775. This created a bullish engulfing candlestick in the weekly time frame. This is a type of candlestick in which the entire previous decrease is negated inside the current weekly increase.
The previous two times this occurred (highlighted in the chart below), BTC rallied by 49% and 40%, respectively.
Despite this increase, technical indicators still provide a mixed outlook.
The MACD, which is created by short and long-term moving averages (MA), is gradually decreasing. This means that the short-term MA is decelerating when compared to the long-term average. However, it’s still positive, indicating that the short-term MA is still moving faster.
The RSI, which is a momentum indicator, is right at the 50-line. This is a sign of a neutral trend since values above 50 are considered bullish while those below 50 are bearish.
However, the indicator has generated a hidden bullish divergence, a strong sign of trend continuation.
BTC Chart By TradingView Ongoing breakoutThe daily chart shows that BTC has broken out from a descending resistance line that had been in place since the Nov 8 all-time high price. This suggested that the correction had come to an end.
Technical indicators also appear to be bullish.
The MACD histogram has created 13 successive higher momentum bars and is nearly positive. In addition to this, the RSI is close to crossing above 50 (green icons). Both of these are considered signs of a bullish trend.
Therefore, the daily time frame provides a more clearly bullish outlook relative to the weekly chart.
The closest resistance area is found between $55,470-$58,640, created by the 0.5-0.618 Fib retracement resistance levels.
BTC Chart By TradingViewThe six-hour chart shows that BTC has potentially been trading inside an ascending parallel channel since the Dec 4 low. It is currently trading at the midline of the channel.
The resistance line of the channel is close to the 0.5 Fib level near $55,500.
BTC Chart By TradingView BTC wave countThe wave count suggests that BTC is in the Y wave of a W-X-Y corrective structure (pink). If waves W and Y have a 1:1 ratio, BTC could reach a high of $55,450, close to the previously outlined resistance area. This entire movement would likely complete a longer-term B wave (black).
If BTC were to move above this area, it would go a long way in confirming that the long-term trend is bullish, and the current upward movement is not just a part of a longer correction.
BTC Chart By TradingViewFor BeInCrypto’s previous Bitcoin (BTC) analysis, click here
The post Bitcoin (BTC) Creates Weekly Bullish Engulfing Candlestick appeared first on BeInCrypto.
origin »Bitcoin price in Telegram @btc_price_every_hour
Bitcoin (BTC) на Currencies.ru
|
|