2021-3-2 09:39 |
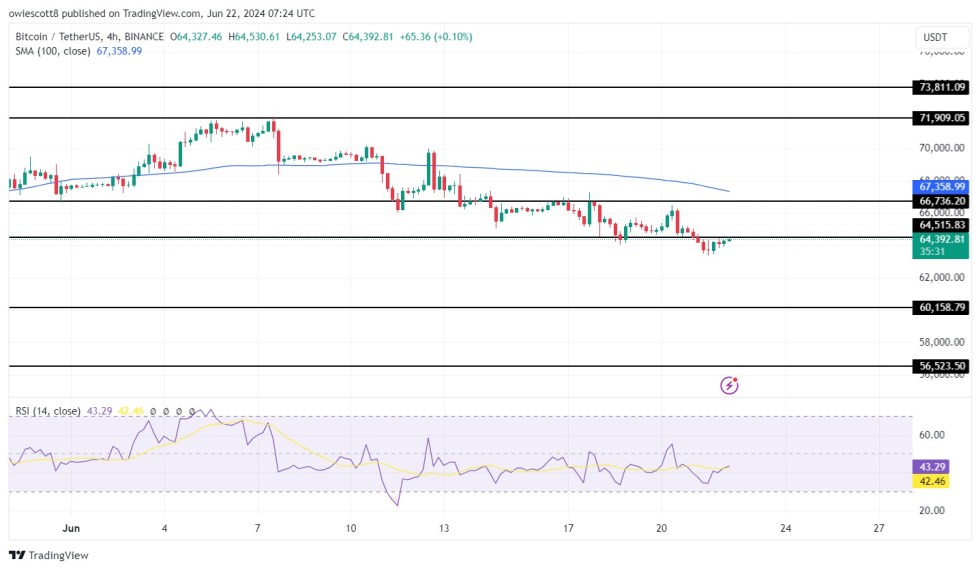
On Mar. 1, Bitcoin (BTC) bounced at the minor $44,600 support area, nearly reaching a high of $50,000 after.
It’s possible that this is the beginning of an upward move that will carry Bitcoin above the current resistance range of $50,650-$52,450.
Bitcoin Bounces at SupportOn Mar. 1, Bitcoin bounced at the minor $44,600 support area and created a bullish engulfing candlestick, reaching a high of $49,790. The bounce also coincided with a daily RSI bounce at the 50-line.
While this is a strong bullish sign, technical indicators have yet to confirm the bullish trend reversal.
The MACD is still decreasing and has failed to generate a higher momentum bar. The Stochastic oscillator has made a bearish cross.
The next support area is found at $38,600.
BTC Chart By TradingView Wedge BreakoutThe six-hour chart shows that BTC has broken out from a descending wedge and is currently approaching the 0.5-0.618 Fib retracement resistance area at $50,650-$52,450.
Technical indicators have turned bullish. The MACD has given a bullish reversal signal and the RSI has crossed above 50.
BTC Chart By TradingViewWhile the two-hour chart shows some weakness in the form of a bearish divergence, it is relatively small. The bearish divergence is insignificant relative to the bullishness from the price action and higher time-frames.
Therefore, while BTC could drop to the minor $47,700 area and validate it as support, it would be expected to move higher after.
BTC Chart By TradingView Wave CountThe wave count suggests that BTC is in sub-wave five of a bullish impulse (white) that began in March 2020.
The top of the movement has a target of $63,900-$66,550, found by a combination of Fib projections and external Fib retracements.
BTC Chart By TradingViewA closer look at the movement shows that the increase looks impulsive. This makes it likely that it’s the beginning of the aforementioned upward movement.
Therefore, while a short-term drop could occur, BTC would be expected to continue moving higher after.
BTC Chart By TradingView ConclusionWhile a short-term drop could potentially transpire, Bitcoin is expected to continue increasing towards the $50,650-$52,450 range before eventually breaking out.
For BeInCrypto’s previous Bitcoin (BTC) analysis, click here.
The post Bitcoin (BTC) Stops Bleeding with Bounce from Support appeared first on BeInCrypto.
origin »Bitcoin price in Telegram @btc_price_every_hour
Bitcoin (BTC) на Currencies.ru
|
|