2022-12-2 06:15 |
Bitcoin price traded above the $17,000 resistance. BTC is correcting gains and might decline towards the $16,650 support zone in the near term.
Bitcoin gained pace and cleared the $17,000 and $17,200 resistance levels. The price is trading above $16,650 and the 100 hourly simple moving average. There was a break below a major bullish trend line with support near $16,980 on the hourly chart of the BTC/USD pair (data feed from Kraken). The pair could correct lower towards the $16,650 and $16,500 support levels. Bitcoin Price Faces BearsBitcoin price attempted a steady increase above the $17,000 resistance zone. It even broke the $17,200 level and settled above the 100 hourly simple moving average.
However, the bears were active above the $17,200 level. A high was formed near $17,319 before the price started a downside correction. There was a move below the $17,000 support zone. The price declined below the 23.6% Fib retracement level of the upward move from the $16,000 swing low to $17,319 high.
Besides, there was a break below a major bullish trend line with support near $16,980 on the hourly chart of the BTC/USD pair. Bitcoin price is still trading above $16,650 and the 100 hourly simple moving average.
On the upside, an immediate resistance is near the $17,000 level. The first major resistance is near the $17,250 zone, above which the price may perhaps start another steady increase. In the stated case, the price could rise towards the $17,800 resistance.
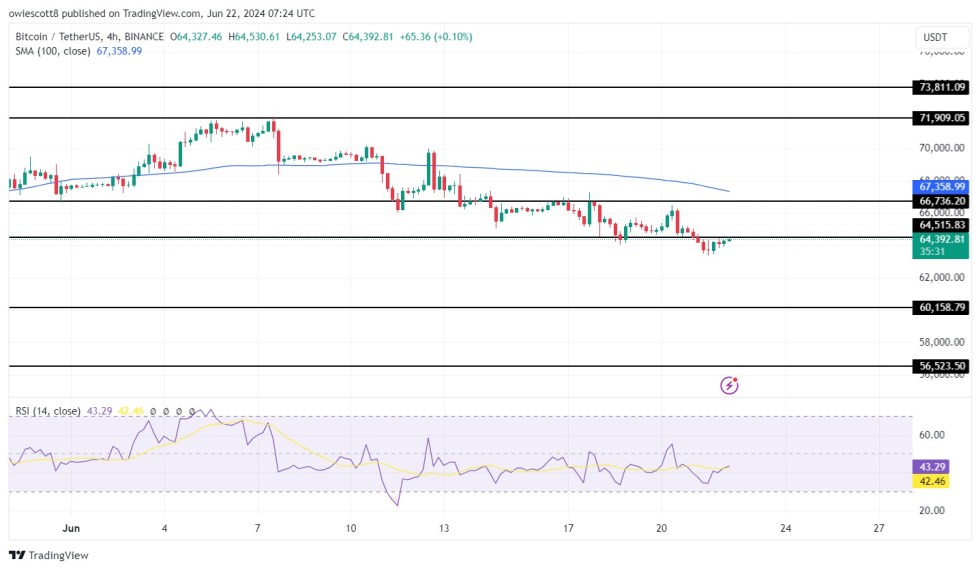
Source: BTCUSD on TradingView.com
The next major resistance is near $18,800, above which the price could attempt a move towards the $19,500 zone in the near term.
Dips Supported in BTC?If bitcoin fails to start a fresh increase above the $17,000 resistance, there could be more downsides. An immediate support on the downside is near the $16,800 level. The next major support is near the $16,650 zone.
The 50% Fib retracement level of the upward move from the $16,000 swing low to $17,319 high is also near the $16,650 support. A downside break below the $16,650 support might call for a move towards $16,500. Any more losses might call for a test of the key $16,000 support zone in the near term.
Technical indicators:
Hourly MACD – The MACD is now losing pace in the bearish zone.
Hourly RSI (Relative Strength Index) – The RSI for BTC/USD is now below the 50 level.
Major Support Levels – $16,800, followed by $16,650.
Major Resistance Levels – $17,000, $17,250 and $17,800.
origin »Bitcoin price in Telegram @btc_price_every_hour
Bitcoin (BTC) на Currencies.ru
|
|