2022-6-6 15:30 |
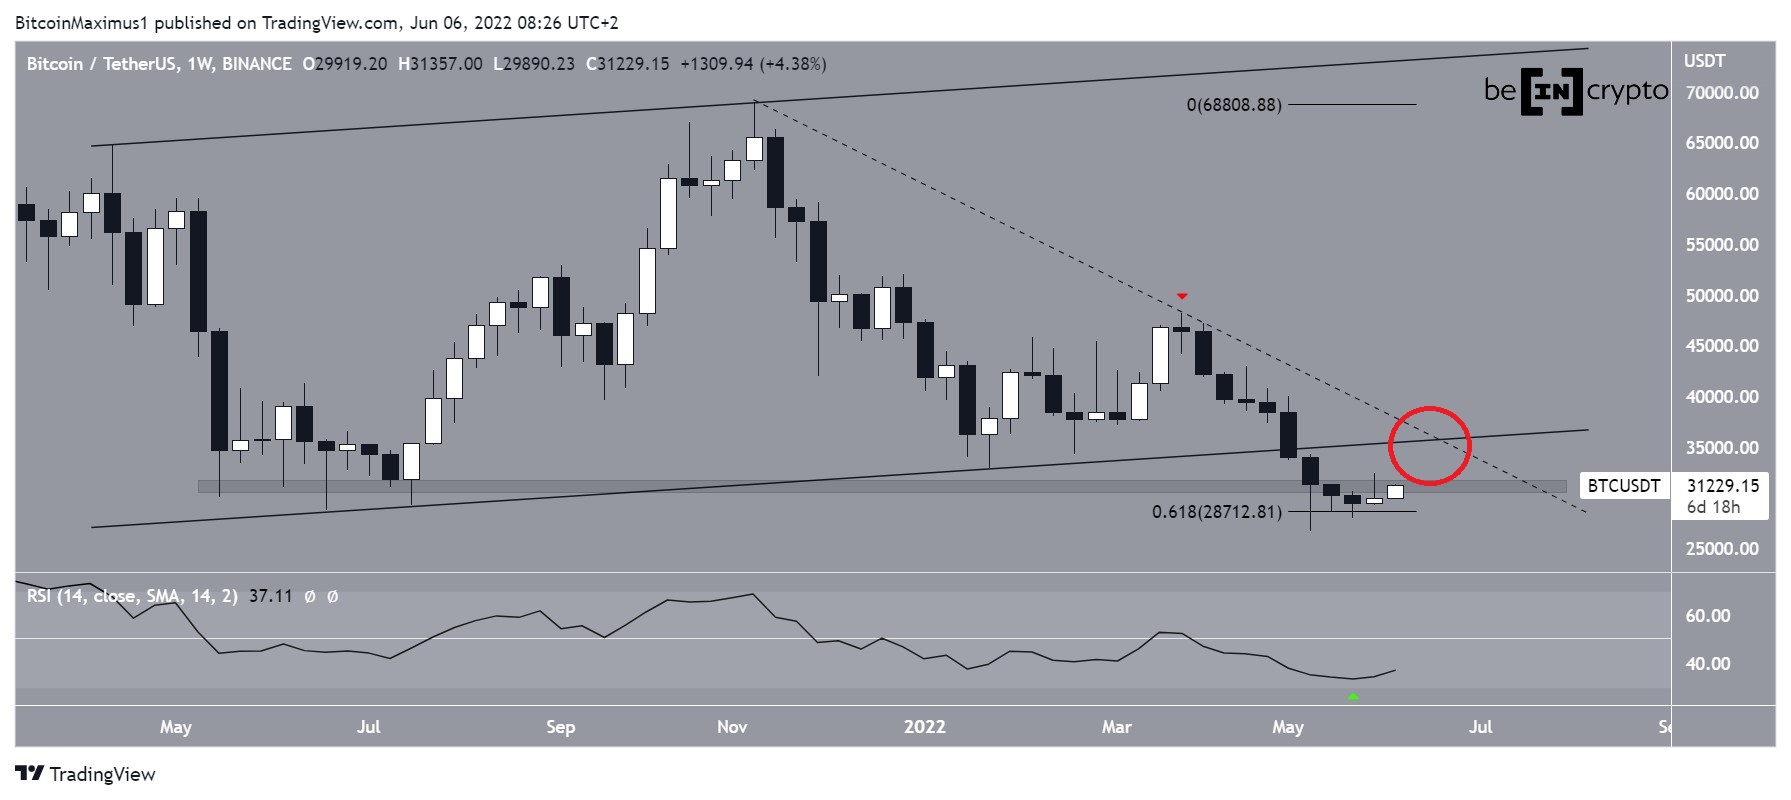
After nine successive bearish weekly closes, bitcoin (BTC) finally had a bullish weekly close from May 30 to June 5.
BTC has been falling since reaching an all-time high price of $69,000 on Nov 8. The downward movement has been contained underneath a descending resistance line (dashed).
More recently, the line rejected the price in March (red icon), leading to nine successive bearish weekly candlestick closes and a low of $26,700. During the week of May 30 to June 5, BTC created the first bullish weekly candlestick since March.
There are three interesting developments based on the price action and technical indicator readings.
BTC has bounced at the 0.618 Fib retracement support level at $28,700. The level is found when measuring the entire upward movement since March 2020. BTC is facing resistance at $31,500. This is a horizontal area that had previously acted as support throughout May to July 2021. The RSI reached a low of 33 in May 2022, the lowest value since March 2020.Two out of three of these developments are bullish.
If the price moves upward and reclaims the $31,500 area, there would be strong resistance near $35,000 (red circle). The resistance is created from the aforementioned descending resistance line and an ascending parallel channel from where the price previously broke down.
BTC/USDT Chart By TradingView Bullish daily RSIThe daily chart suggests that the ongoing bounce is expected to continue, meaning that BTC can reach the aforementioned confluence of resistance levels near $35,000.
The reason for this is the RSI reading in the daily time frame.
Firstly, the RSI has broken out from a descending resistance line that had previously been in place since April (dashed). Such an RSI breakout often precedes a price breakout.
Secondly, the RSI has generated a bullish divergence (green line), whose trendline is still intact.
Finally, the RSI is very close to moving above 50.
If the price breaks out from the current descending resistance line (solid), it would be expected to increase towards the $35,000 level.
BTC/USDT Chart By TradingView Short-term BTC movementFinally, the shorter-term six-hour chart shows that the price could be following an ascending support line and potentially trading inside an ascending triangle.
Since the ascending triangle is considered a bullish pattern, it supports the possibility of a breakout from the channel.
BTC/USDT Chart By TradingViewFor Be[in]Crypto’s previous bitcoin (BTC) analysis, click here
The post Bitcoin (BTC) Finally Creates Bullish Weekly Candlestick appeared first on BeInCrypto.
origin »Bitcoin price in Telegram @btc_price_every_hour
Bitcoin (BTC) на Currencies.ru
|
|