2020-10-2 16:52 |
VeChain (VET) has been following a resistance line since reaching a high on Aug. 9. Until the price breaks out above it, the trend is bearish.
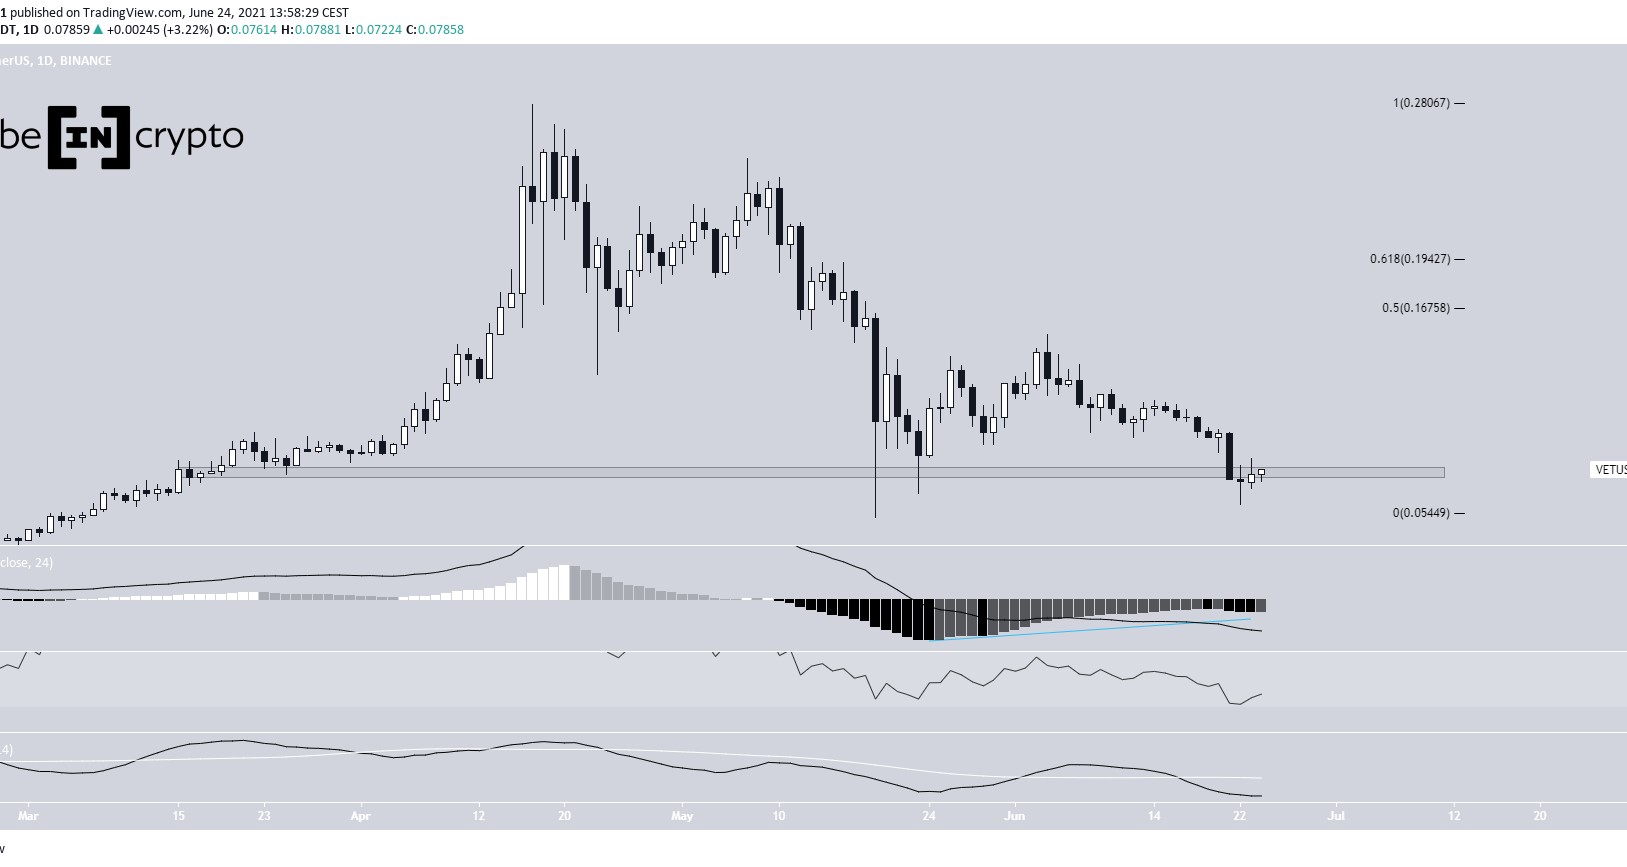
Descending Resistance LineOn Aug. 9, the VET price reached a high of $0.022 and began a downward move, which continued until a low of $0.011 was reached on Sept. 7.
Since the previous Aug. 9 high, the price has been following a descending resistance line which has rejected four rallies so far. In addition, there is a strong resistance area at $0.0155, which previously acted as support.
Until the price manages to break out from the descending resistance line and reclaim the $0.0155 area, the trend is considered bearish.
VET Chart By TradingViewTechnical indicators give an ambiguous outlook. The MACD is moving upwards but has not reached positive territory yet. The RSI was rejected by the 50 line and is falling. The Stochastic Oscillator has made a bullish cross and is moving upwards.
Since there is no confirmation from technical indicators, the bearish trend hypothesis, outlined above, stands.
VET Chart By TradingView VET/BTCCryptocurrency trader @IncomeSharks outlined a VET/BTC chart which shows a bullish technical indicator that suggests the trend will continue.
Source: TwitterThe VET/BTC chart shows similar movements relative to its USD counterpart, especially in the creation of a descending resistance line.
However, technical indicators are slightly more bullish, since the RSI has formed considerable bullish divergence, which is not present in VET/USD.
This indicates that a breakout from the resistance line is likely.
VET Chart By TradingView Wave CountSince the previous Aug. 9 high, it seems likely that VET has been mired inside an A-B-C correction (shown in black below), having currently begun the B wave.
The A portion of the correction took place inside a three-wave formation (a-b-c in orange, a:c = 1:1.61 ratio), and the price has likely begun wave B. Since the preceding fall took three waves, wave B should retrace significantly all the way to the 0.9 Fib level of the entire decline at $0.021.
After that, another decline is also likely.
VET Chart By TradingViewTo conclude, the VET trend is bearish until the price can break out above the current descending resistance line. It’s likely that the price is inside an A-B-C correction.
For BeInCrypto’s Bitcoin analysis, click here!
Disclaimer: Cryptocurrency trading carries a high level of risk, and may not be suitable for all investors. The views expressed in this article do not reflect those of BeInCrypto.
The post VeChain (VET) Drops Noticeably After Rejection From Resistance Line appeared first on BeInCrypto.
origin »Bitcoin price in Telegram @btc_price_every_hour
Resistance (RES) на Currencies.ru
|
|