2020-5-19 11:36 |
The Bitcoin (BTC) price has created a weekly bullish engulfing candlestick and moved above a long-term descending resistance line.
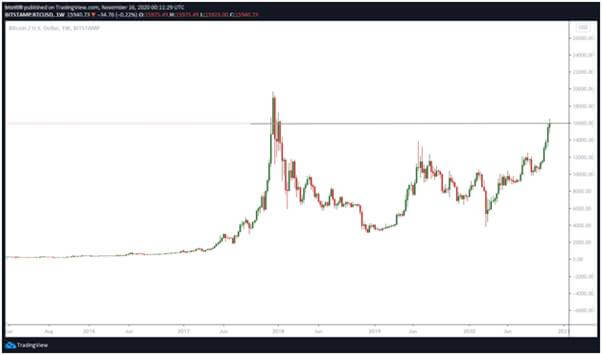
Weekly Bitcoin OutlookIn the weekly chart, the price of Bitcoin (BTC) followed a doji from the previous week by creating a bullish engulfing candlestick. It closed well into the doji resistance from last week, canceling the bearishness and possible reversal from that candlestick. The candlestick was created with above-average volume, increasing its significance.
Another bullish sign is the fact that the price has moved above the descending resistance line that has been in place since the all-time high of December 2017. This is possibly a sign that the downward trend has ended and the price has begun a new upward trend.
In the weekly time-frame, the closest resistance and support levels are found at $11,400 and $6500, respectively.
Bitcoin Chart by Trading View Daily OutlookIn the daily outlook, the main resistance area is found at $10,450, while the closest support is at $9200. In addition, the BTC price has been following a very steep ascending support line — one that has been in place since the March 13 bottom.
At the time of writing, the Bitcoin price was trading between these two areas. Since there is no bearish divergence in the RSI, even though it reached overbought levels on May 7, the price is expected to move upwards as long as this ascending support line holds.
Bitcoin Chart by Trading View Short-Term MovementIn the short-term, the Bitcoin price is following an even steeper ascending support line (dashed). Furthermore, it has begun to generate some bearish divergence in the RSI.
Therefore, there are two possible options here. The first one is that the price bounces on this support line and then heads towards the resistance mentioned from the previous section at $10,450. The second one has the price breaking down from this support line, touching the support line on the daily, and then moving towards $10,450.
Bitcoin Chart by Trading ViewTo conclude, the Bitcoin price has broken out above a long-term descending resistance line — possibly indicating that it is in a long-term bullish trend. The closest short-term resistance is found at $10,450.
For those interested in BeInCrypto’s previous Bitcoin analysis, click here.
The post Is Bitcoin in a Long-Term Bullish Trend? appeared first on BeInCrypto.
origin »Bitcoin price in Telegram @btc_price_every_hour
Bitcoin (BTC) на Currencies.ru
|
|