2020-11-16 13:21 |
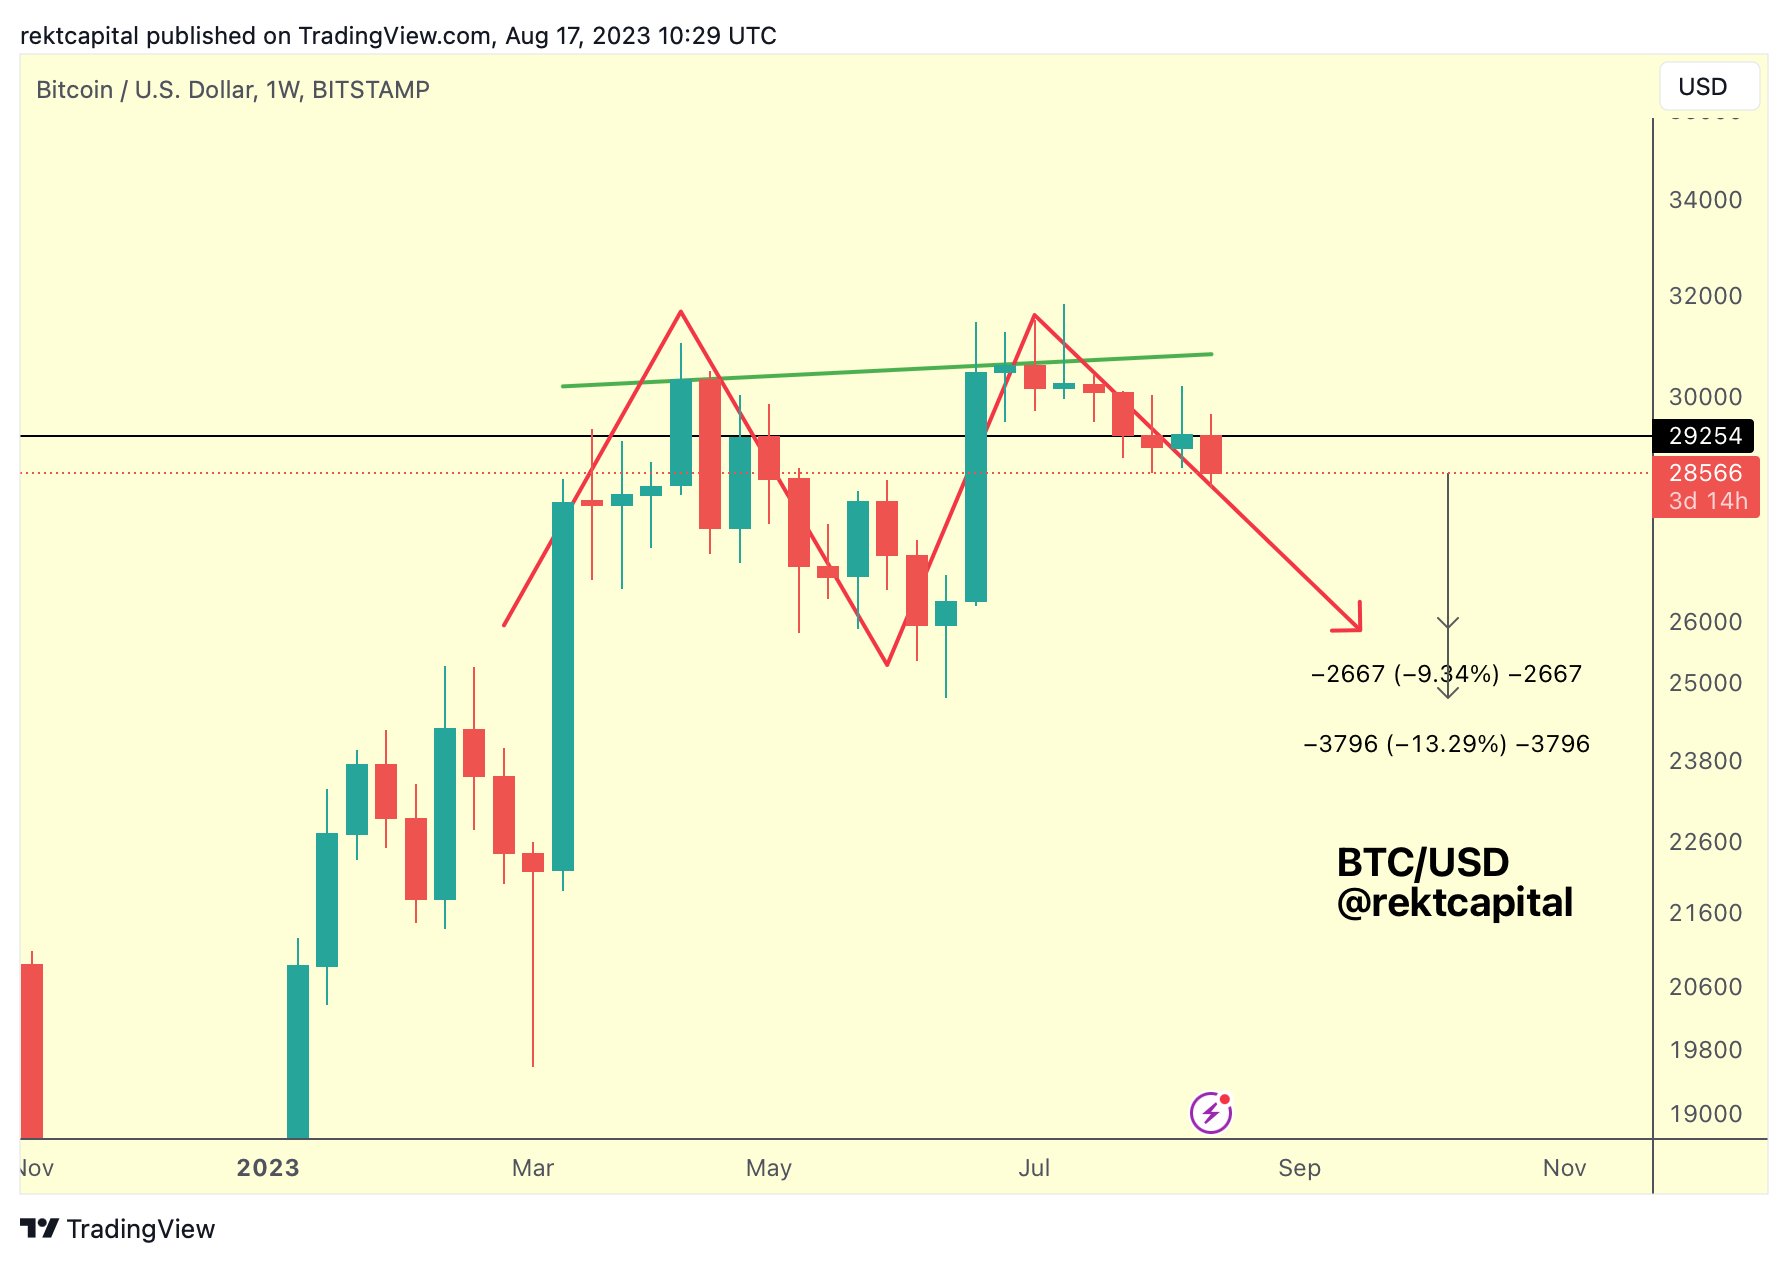
If Bitcoin bounces higher from the $15,975 weekly close, a retest of 2020 highs around $16,494 would likely see it print its second-highest green candle on the weekly chart
This past week, Bitcoin news was dominated by PayPal for crypto in the US, a Chinese bank shelling out $3 billion worth of bonds for the digital asset and billionaire investor Stanley Druckenmiller talking up Bitcoin over gold.
In the market, Bitcoin’s price soared to a new year-to-date high of $16,494. However, the week also saw bears plunge prices to lows of $14,824, with another rejection at $16K seeing the bulls stage a comeback from $15,713 to close at $15,975. The close is now Bitcoin’s third-highest ever weekly candle and comes after a sixth straight green candlestick on the seven-day log.
The last time the BTC price on the weekly log was higher than $15,975 was the first week of January 2018. At the time, the digital asset closed at $16,124- which is what bulls need to aim for if they are to print the highest weekly close since December 2017.
Bitcoin price weekly chart. Source: TradingView BTC/USDBTC/USD has traded above the 10-day exponential moving average on the daily chart since early October, a trend bulls need to maintain to remain in control. The daily chart below shows that the 10-day EMA currently provides support at $15,696.
The technical picture also shows that Bitcoin is well above the 50-day simple moving average ($12,902), while the Relative Strength Index (RSI) is within the overbought territory but not yet overextended. From this perspective, BTC bulls appear to have the upper hand and could push above $16,000 to retest resistance near $16,500.
BTC price daily chart. Source: TradingViewIf buy-side pressure holds and the BTC/USD trades well above the above-mentioned barrier, the next target will be the psychological level at $17,000. Bulls are then likely to face a stronger challenge at around $17,200.
If the bulls fail to hold prices above the 10-day EMA, increased sell-off pressure could push Bitcoin towards two support zones — $14,800 and $14,000.
BTC/USD 4-hour chart. Source: TradingViewOn the 4-hour chart, BTC/USD is just below the 10-EMA ($15,990), with the flattening curve of the moving average suggesting a weakening of the bullish momentum.
The RSI is also suggesting a bearish divergence, with the indicator ticking just above the midpoint.
Bitcoin price is, therefore, likely to struggle around the $16,000 area.
However, the 50-SMA on the 4-hour chart ($15,710) provides immediate support should the bears take advantage. If the downward pressure increases, the BTC price could drop to $14,800. The next support level is at $14,400 and then $14,000.
At the time of writing, the flagship cryptocurrency is trading at around $15,977.
The post Bitcoin price outlook: BTC/USD hits third-highest ever weekly close appeared first on Coin Journal.
origin »Bitcoin price in Telegram @btc_price_every_hour
Bitcoin (BTC) на Currencies.ru
|
|