2020-7-2 00:00 |
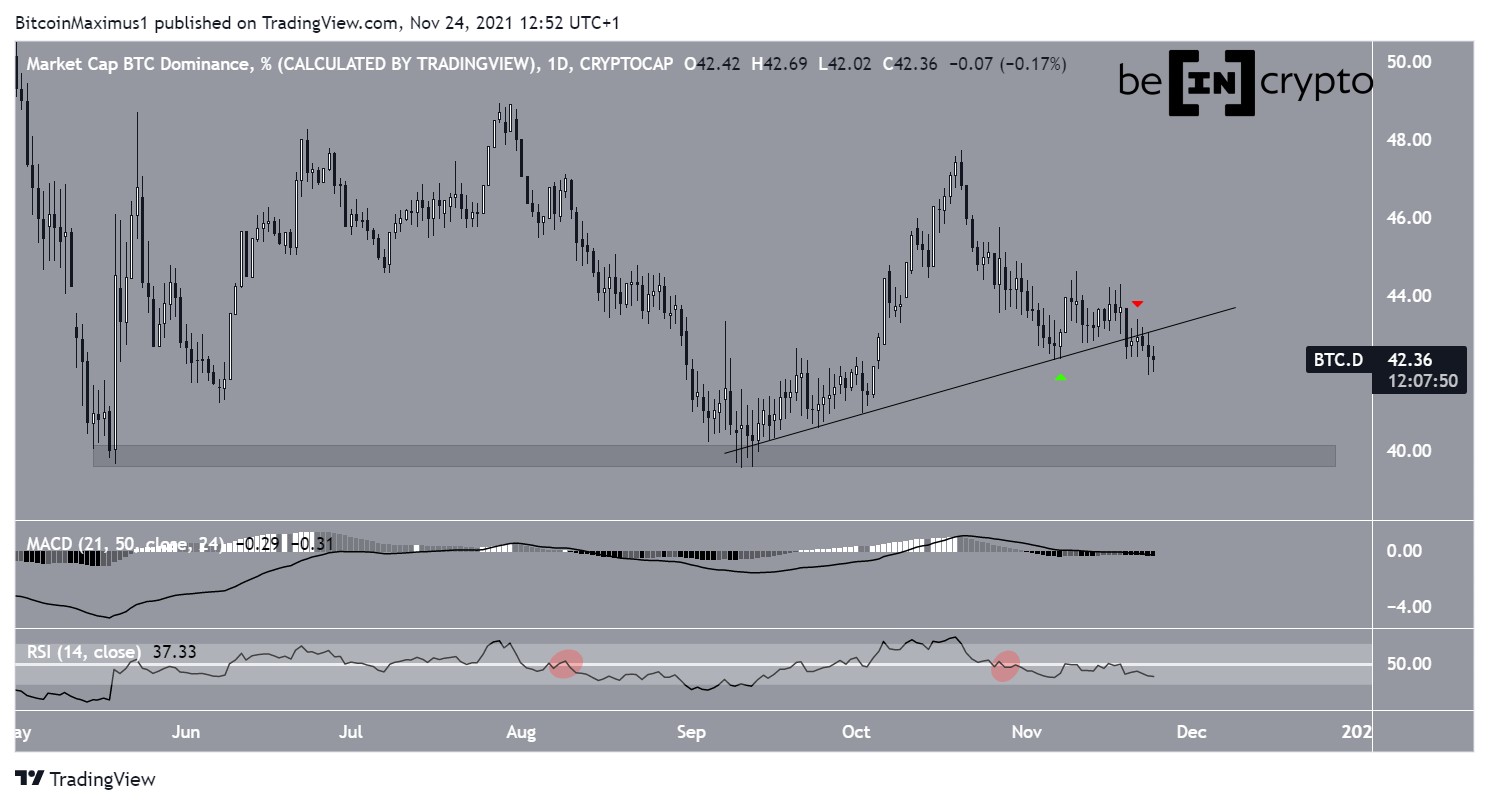
The Bitcoin dominance rate (BTCD) has broken down from a long-term rising support line. Unless it successfully reclaims the 66.5% resistance area, the trend remains bearish.
Double BottomThe Bitcoin dominance rate has been gradually increasing since June 24. The rate of increase accelerated on June 27, reaching a high of 66.49%. However, the price has been decreasing since, following a descending resistance line.
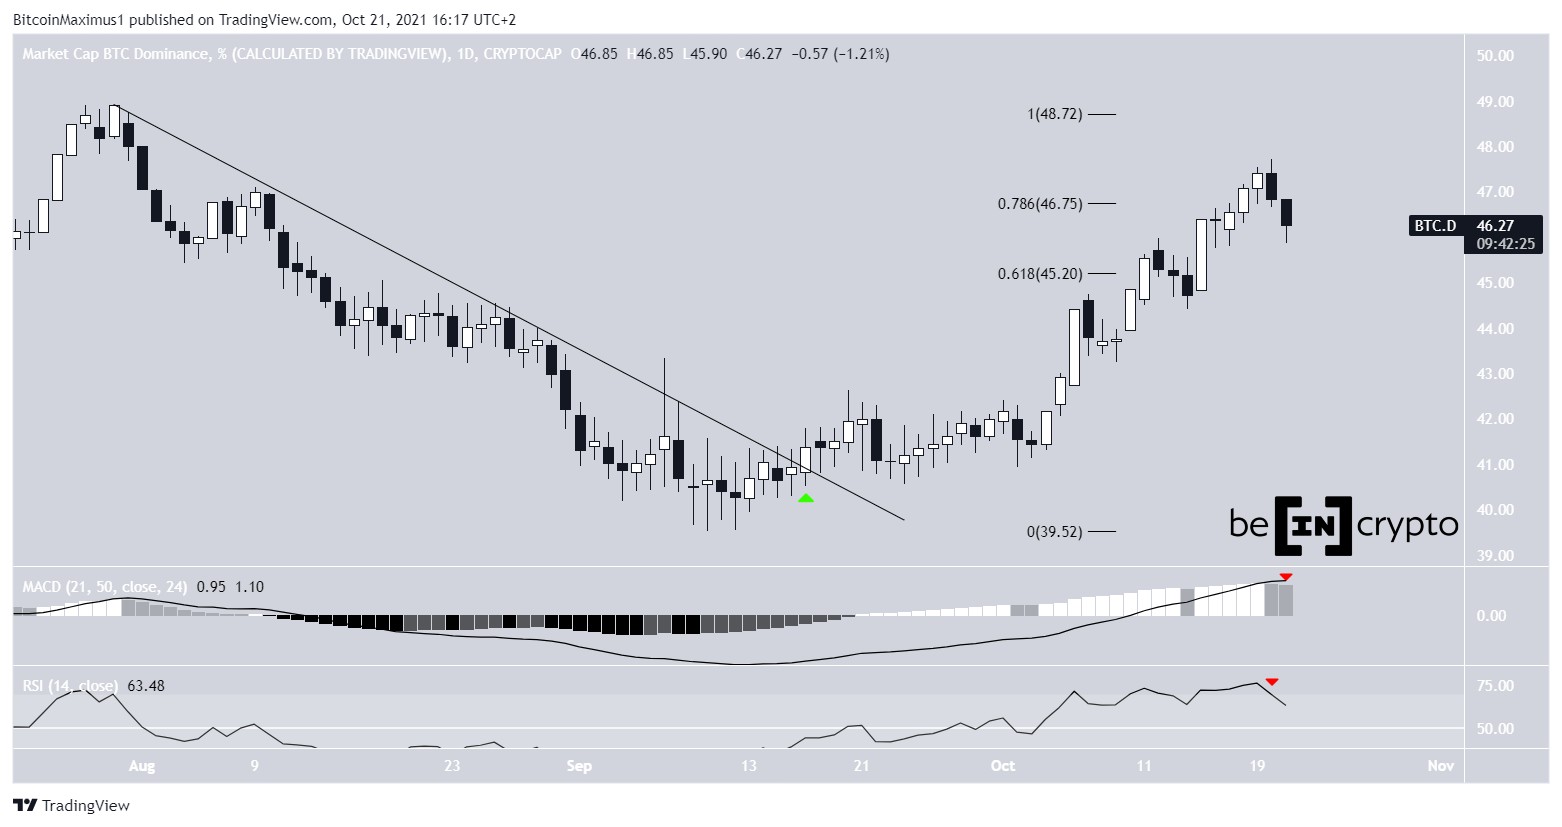
However, it has created a double bottom pattern at 66%, the 0.619 Fib level of the entire upward move. While this is widely considered to be a bullish reversal pattern, there is no bullish divergence on the RSI to suggest a reversal.
A breakdown from this support level could take the rate all the way to the beginning of the upward move at 65.7%.
Given that the descending resistance line and support area will soon coincide with each other, the direction of the trend should be revealed shortly.
BTCD Chart By TradingviewA slightly longer-term look reveals a different descending resistance line that currently coincides with the 66.5% resistance area. Until the rate breaks out above this level, the trend cannot be considered bullish.
In addition, the pattern of lower highs and identical lows resembles a descending triangle, which is a bearish pattern.
BTCD Chart By Tradingview Long-Term MovementCryptocurrency trader @Damskotrades tweeted a long-term chart for BTCD, stating that he believes it will increase and that altcoins will bleed.
Let’s move on to Bitcoin Dominance.
– Weekly demand
– Consolidation /side ways
– Higher low zone
Bitcoin dominance at Weekly support while forming higher lows. Bad spot to step in Altcoin longs.
Source: TwitterIndeed, the rate has been making lower highs since January 2018. However, the trend seems to have reversed in September 2019, and BTCD has made several lower highs since then.
Furthermore, there is a possible ascending support line that has been in place since January 2018, which now appears to be broken. This supports a decline towards the 62% area.
BTCD Chart By TradingviewThe daily chart confirms the importance of the previously mentioned 66.5% resistance area. The area coincides with the 200-day moving average (MA), which made a bearish cross along with the 50-day MA.
Until the price successfully breaks out above this area and the two MAs, the trend cannot be considered bullish, and a decline towards 64.5%, and eventually 62%, is more likely.
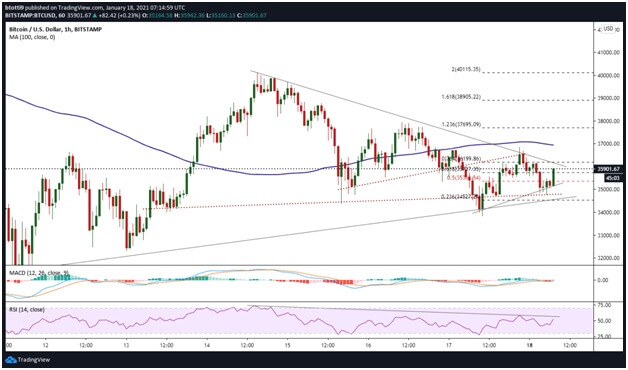
BTCD Chart By Tradingview Relationship to BitcoinThe relationship between the Bitcoin dominance rate and the price of Bitcoin has been unclear since the beginning of June.
Observe the price of BTC (blue) placed side-by-side with the BTCD (candlesticks) in the image below. The white shading represents a positive relationship, meaning a BTC increase causes an increase in BTCD. The opposite is true for the black shading.
The relationship between them has mostly been positive. However, there have been two periods of around four days, the second of which is ongoing, in which BTC declines caused an increase in BTCD.
This is particularly evident during sharp BTC price drops, which have caused an equally sharp increase in BTCD.
Therefore, if the BTC price were to drop, we would expect altcoins to drop at an accelerated rate, causing an increase in BTCD.
The post A Detailed Look at the Bitcoin Dominance Rate appeared first on BeInCrypto.
origin »Bitcoin price in Telegram @btc_price_every_hour
Bitcoin (BTC) на Currencies.ru
|
|