2020-6-30 14:10 |
Cosmos (ATOM) has broken out from a long-term descending resistance line and validated it as support afterward. The price is expected to continue moving upwards.
IOTA (IOTA) has created a bullish hammer and is in the process of breaking out from a similar descending resistance line.
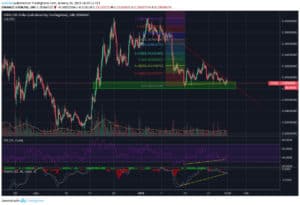
Cosmos (ATOM)On June 4, the ATOM price broke out from a descending resistance line it had been following since Dec 27, 2019. The breakout transpired with above-average volume and was preceded by bullish divergence in the RSI, increasing its significance.
After breaking out, the price returned to validate the resistance line along with the 2600 satoshi support area, above which it has been trading since September 2019.
As long as the price is trading above this area, it is expected to continue moving upwards, with a long-term target being the top of the descending resistance line at 6500 satoshis.
ATOM Chart By TradingviewThe shorter-term chart also paints a bullish view. While ATOM initially decreased below the minor 2760 support area, it moved above it after a significant bullish divergence. The reclaim of this support area has major bullish implications since the lower prices could not be sustained, leaving a long lower-wick in place.
However, the price is currently facing resistance from the 50-day moving average (MA), which has twice rejected the price until now. A flip of this MA should allow the price to move towards the recent highs at 3250 satoshis.
ATOM Chart By TradingviewCryptocurrency trader @ImBagsy stated that he is bullish on ATOM, but is waiting for a flip of the 3250 area in order to enter. This is the same level as our closest resistance area, so a breakout above it would likely trigger a rapid increase.
$ATOM
I’m close to buying a bag, however instead of buying here I’ll wait for a convincing flip of 3243 into support first.
Source: Twitter IOTA (IOTA)Similar to ATOM, IOTA has been following a descending resistance line, albeit a shorter-term one, in place only since June 4. Even though the price has yet to break out above it, the current price movement looks bullish.
First, the price decreased below the minor support area at 2305 satoshis and the 50-day MA, only to create a bullish hammer and move right back above them. Whenever lower prices cannot be sustained and the price reclaims the previous breakdown level, it usually has bullish implications, as we saw with ATOM in the shorter-term.
Therefore, IOTA is expected to break out from this line and move towards 2450-2500 satoshis, the 0.5-0.618 Fib levels of the decrease as well as the 200-day MA.
IOTA Chart By TradingviewCheck out BeInCrypto’s latest Bitcoin analysis here!
The post ATOM Breaks Above Resistance, IOTA May Soon Follow appeared first on BeInCrypto.
origin »Bitcoin price in Telegram @btc_price_every_hour
IOTA (IOTA) на Currencies.ru
|
|