2020-5-7 01:37 |
On May 6, the Bitcoin price finally broke out from the resistance line it had been following over the past week. This could be a sign that the BTC price is ready to move towards new highs.
In this article, we will take a look at the Bitcoin price movement, along with nine other cryptocurrencies, and attempt to determine where they are heading to next.
Bitcoin (BTC)The Bitcoin price has been decreasing since it reached a high of $9460 on April 30. During this decrease, the price has followed a descending resistance line. On May 6, the price broke out above this resistance line and did so with high volume — increasing the legitimacy of the movement.
The BTC price is expected to continue increasing until $9450, the closest minor resistance area.
Bitcoin Chart By Trading View Ethereum (ETH)The Ethereum price has been decreasing since April 30, when it reached a high of $227.5 The decrease has taken the form of either a descending wedge or channel. The uncertainty comes from several long lower wicks, which make the exact slope of the line uncertain. At the time of writing, the price was trading right a the resistance line of this wedge, which is strengthened by the presence of the 200-day MA.
On May 3, the Ethereum price broke down from an ascending support line — one that had been in place since April 16. This makes any possible breakout from the current wedge more likely to be a retracement than a new upward move.
The most likely move would be a retest of the descending support line and the closest minor support area at $192, followed by a breakout that takes the price towards $220.
Ethereum Chart By Trading View XRP (XRP)The XRP price has been decreasing since April 30, when the price reached a high of $0.236. The high was reached inside a significant resistance area and the price was sharply rejected from it. The decrease continued until May 3, when the price reached the ascending support line that XRP had been following over the past four days. Since then, the price has increased slightly.
The recent increase has caused the price to break out from a short-term descending resistance line (dashed). This makes it likely that XRP will continue increasing, possibly reaching the $0.235 resistance area once more. As long as the RSI stays above the 50 line and the ascending support line is intact, XRP is expected to make another attempt at moving above $0.235.
XRP Chart By Trading View Bitcoin Cash (BCH)The Bitcoin Cash price has been decreasing since March 9, trading inside a symmetrical triangle. Until now, the price has validated both the resistance and support lines of the triangle four times.
The main resistance area is found at $275 satoshis. The price has reached this area twice, but created a very long upper wick and proceeded to decrease rapidly. This is a bearish sign indicating that there is significant selling pressure around this level.
The closest support area is found at $245. The price reached it yesterday and began an upward move, one that is still ongoing. The most likely movement from here would be a re-test of the resistance line followed by a drop towards support. At the time of writing, we cannot confidently state whether the price will break out or break down from this triangle.
BCH Chart By Trading View Bitcoin SV (BSV)The Bitcoin SV price is trading inside an ascending channel and has been doing so since April 5. The price reached the resistance line of the channel on April 28 and has been decreasing since. Yesterday, BSV briefly decreased below the midpoint of the channel — but has reclaimed it, since.
In addition, the RSI has also bounced at the 50 line — a bullish indicator. Therefore, the BSV price is expected to increase towards the resistance line of the channel.
BSV Chart By Trading View Litecoin (LTC)The Litecoin price is trading inside a descending wedge and has been doing so since it was rejected by the resistance line of the long-term ascending channel on April 30.
The LTC price has lost the support of the $47 area, which is now likely to act as resistance in the near future. This movement was combined with an RSI decrease below the 50 line — another bearish indication.
Therefore, the price is expected to continue decreasing at the rate predicted by the descending wedge.
LTC Chart By Trading View Binance Coin (BNB)The Binance Coin (BNB) price has been decreasing since reaching a high of $19.15 on April 30. During this time, the price has been following a descending resistance line. On May 4, the price reached the $16.5 support area, which is also strengthened by the presence of the 400-hour moving average (MA). This MA has previously offered support to the price on April 22 and was the catalyst of the upward move that eventually lead to the $19.15 high.
Considering the fact that the BNB price is resting at a confluence of very strong support, BNB is expected to break out and move towards the closest resistance area at $18.
BNB Chart By Trading View EOS (EOS)The EOS price has been increasing and following an ascending support line since March 13. The increase continued until April 30, when the price reached a high of $3.11. However, EOS was rejected by both the 200-day MA and the $3.10 resistance area and has been decreasing since.
The decrease continued until May 4, when the price reached the previously mentioned ascending support line and created a very long lower wick — a sign of buying pressure. In addition, it bounced on the minor support area of $2.7.
Therefore, the EOS price is expected to make another attempt at moving above the $3.1 resistance area.
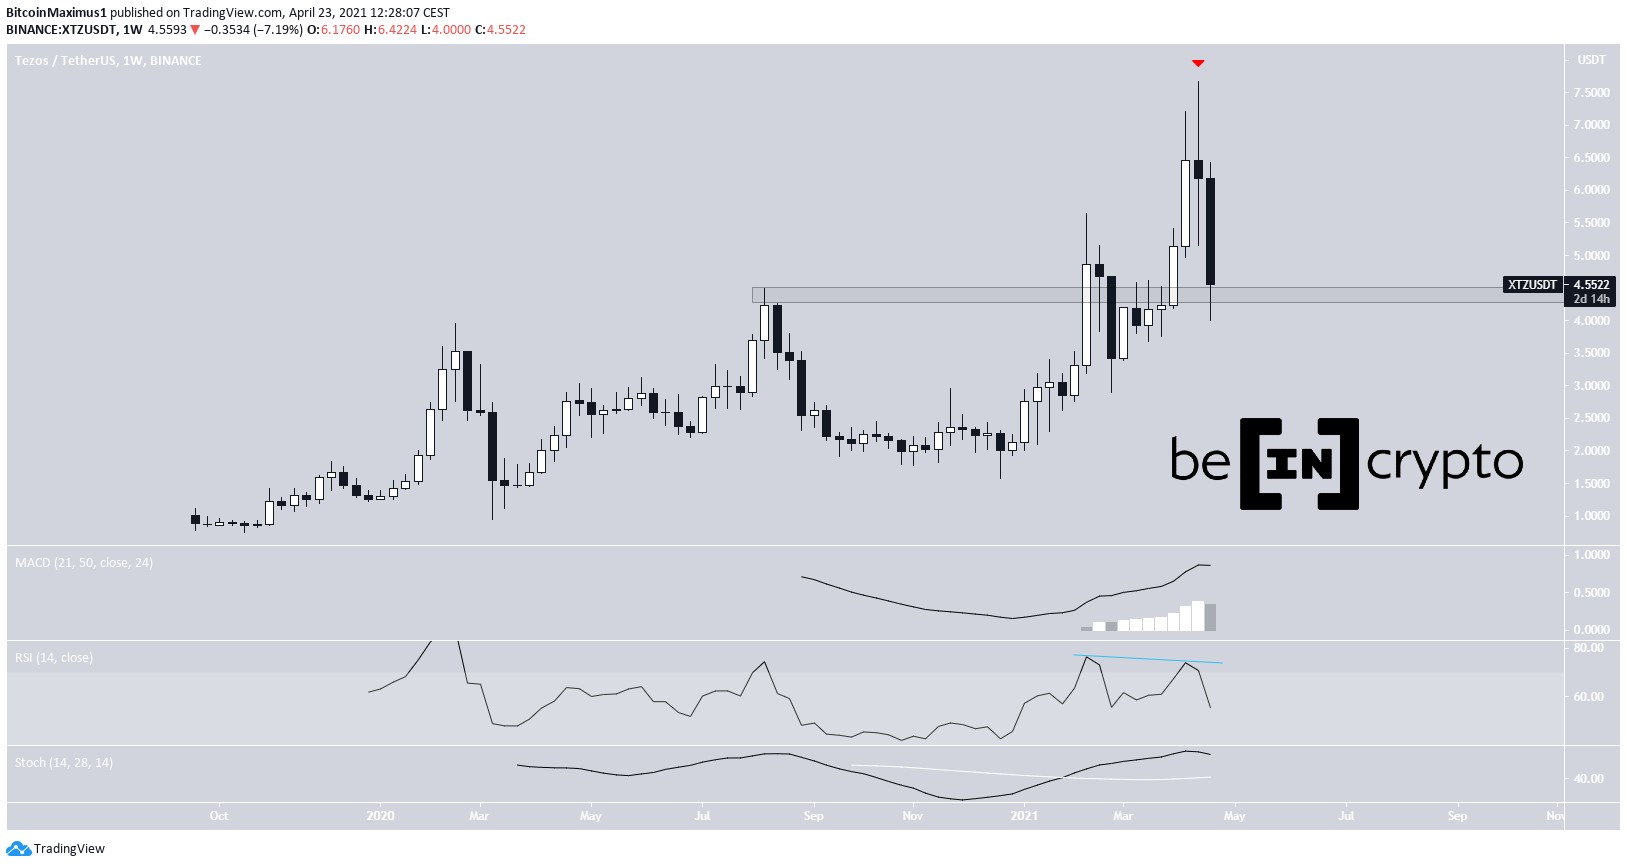
EOS Chart By Trading View Tezos (XTZ)The Tezos (XTZ) price has been decreasing since it reached a high of $3.04 on April 30. Since then, the price has been following a descending resistance line.
On May 4, the price broke out from this line and validated it as support the next day. This movement was combined with an RSI movement above the 50 line — a sign that the trend is bullish.
Therefore, the XTZ price is expected to make another attempt at moving towards the resistance area at $3.
XTZ Chart By Trading View Chainlink (LINK)The LINK price has been following an ascending support line since reaching a bottom on March 13. The rate of increase accelerated on April 12 and the price has not dropped to the support line since.
However, there has been significant bearish divergence developing in the RSI. This preceded the current downward move, which began on April 29, when the price reached a high of $3.99.
So, the LINK price is expected to decrease towards the ascending support line, which currently stands at $3.40. Prior to doing this, another increase towards the resistance area at $4.00 is not ruled out.
LINK Chart By Trading ViewThe post Crypto Price Analysis May 6: BTC, ETH, XRP, BCH, BSV, LTC, BNB, EOS, XTZ, LINK appeared first on BeInCrypto.
origin »Bitcoin price in Telegram @btc_price_every_hour
Bitcoin (BTC) на Currencies.ru
|
|