2020-8-18 13:00 |
Bitcoin has stalled despite posting a weekly close above the pivotal $11,800 level that analysts eyed. BTC remains in a textbook bullish chart pattern. That pattern is an ascending triangle, which has been a pattern of importance throughout Bitcoin’s history. This specific iteration of the pattern predicts that Bitcoin will soon hit $13,000. As of this article’s writing, BTC trades for $11,820, down slightly in the past 24 hours. Bitcoin Could Soon Hit $13,000, Ascending Triangle Pattern Predicts
Bitcoin is on track to hit $13,000 in the near future as it continues to confirm a textbook bullish pattern, one trader has suggested.
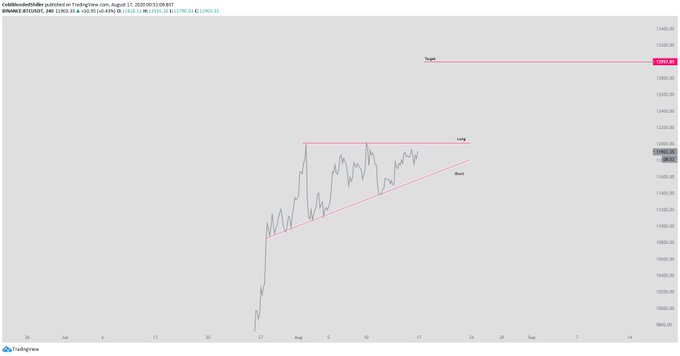
Referencing how Bitcoin has formed an ascending triangle marked by higher lows and equal highs, he wrote in regards to the chart below:
“As easy as it gets. The simple $BTC plays.”
Chart of BTC's price action over the past few weeks with an analysis by trader Cold Blooded Shiller (@ColdBloodshill on Twitter). Chart from TradingView.comNot everyone thinks this is a textbook ascending triangle, though.
As reported by Bitcoinist, one trader postulated that the ascending triangle is slowly converting into a rising wedge. A rising wedge looks similar to an ascending triangle, but is actually seen as a textbook bearish pattern as it often precedes retracements.
The trader in question remarked that Bitcoin may be in dangerous territory because the rising wedge is forming, along with bearish divergences:
“The bullish ascending triangle (preceded by a rising trend, which is good) started to look like a bearish rising wedge. Together with extended bearish (potentially exaggerated) divergencies the situation becomes slightly dangerous for bulls.”
Chart of BTC's price action over the past few weeks with an analysis of the price action, RSI, and MACD by trader CryptoHamster (@CryptoHamsterIO on TWitter). Chart from TradingView.com How Fundamentals Could Boost BTC FurtherFundamentals are expected to push the leading cryptocurrency higher, likely towards $14,000, then $20,000 according to Mike Novogratz.
The Galaxy Digital chief executive said to CNBC earlier this month that the increase in money printing by central banks will boost Bitcoin. This is likely in reference to how the supply of the leading cryptocurrency is fixed whilst fiat monies can be printed at will.
As Bloomberg wrote on Novogratz’s recent comments:
“He said he thought the cryptocurrency, which has surged in value in recent weeks, had “crossed the Rubicon” on the question of whether it’s a good store of value, and said he considers it a better investment than gold at the moment.”
Other fundamentals set to strengthen Bitcoin’s case for upside include the increase in circulating USDT, Dave Portnoy buying BTC, and an increase in the hash rate.
Photo by Hudson Fega on Unsplash Price tags: xbtusd, btcusd, btcusdt Charts from TradingView.com This Textbook Chart Pattern Predicts Bitcoin Will Hit $13,000 Imminently origin »Bitcoin price in Telegram @btc_price_every_hour
Bitcoin (BTC) на Currencies.ru
|
|