2020-3-27 13:20 |
Over the past three days, the Bitcoin price has been trading in a range between $6,500-$6,900 and has made several unsuccessful attempts at breaking out above the latter. It has possibly created a short-term bearish pattern.
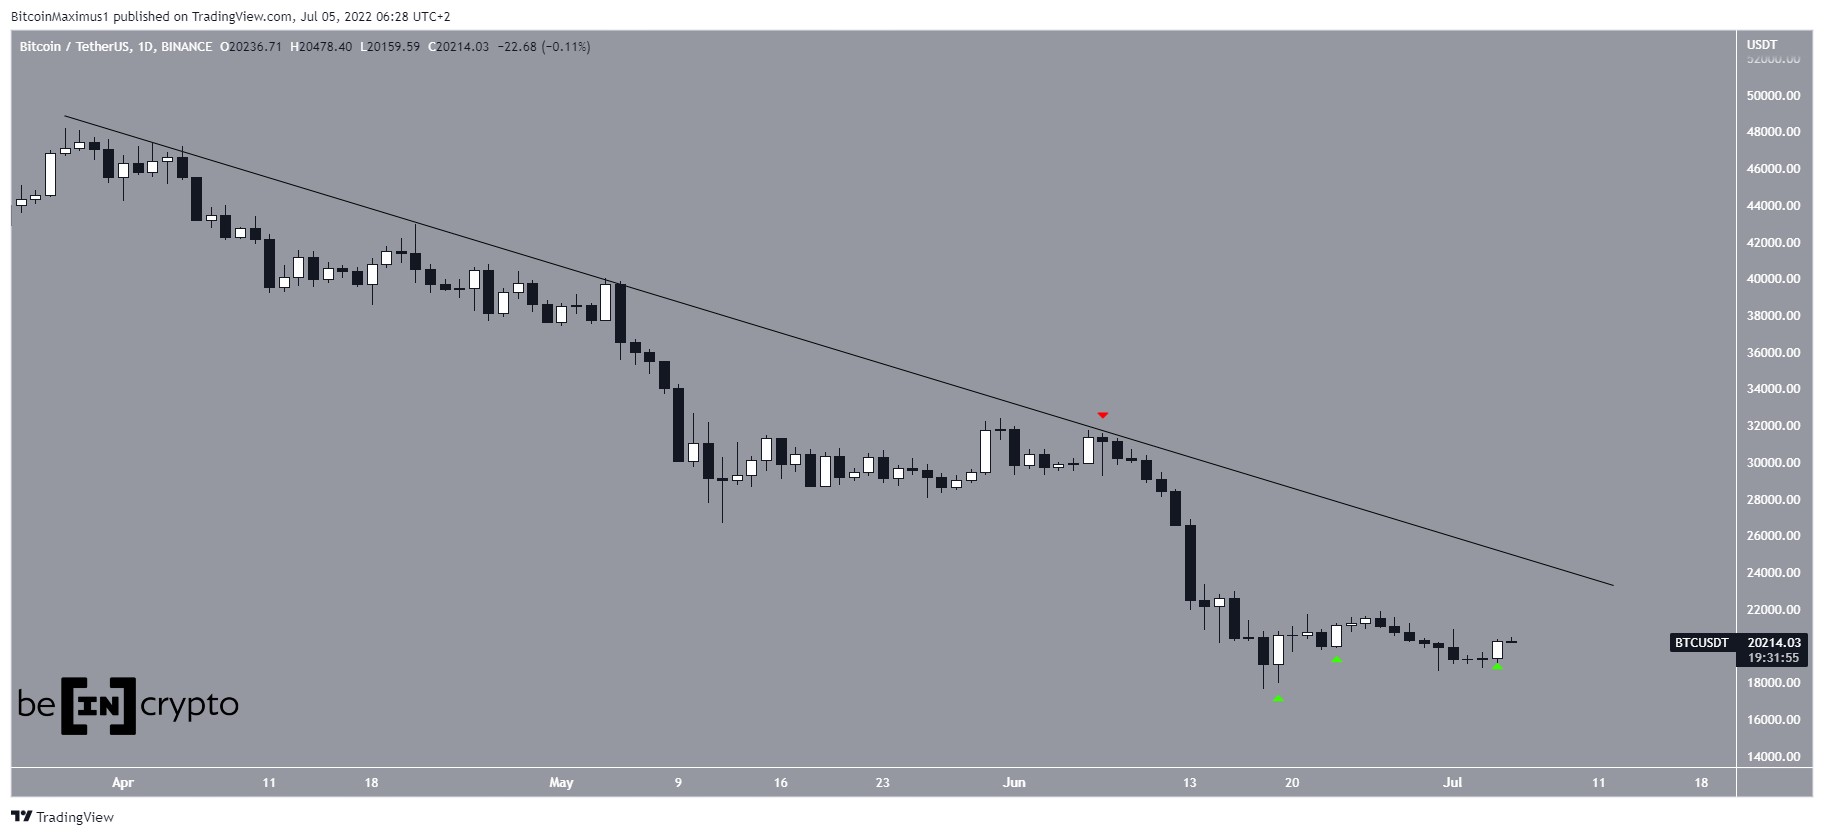
Bitcoin Ascending Support LineThe Bitcoin price has been following an ascending support line since March 13. At the time of publishing, it was very close to validating this support for the fourth time.
Throughout riding this ascending support line, the price has reached a high of nearly $6,900 three times. However, the RSI-highs have been smaller each time. This is known as bearish divergence and often precedes price decreases. Finally, the trend-line of the bearish divergence has yet to break down.
In addition, candlestick values near $6,900 have been characterized with long upper wicks, a bearish sign that supports further price movements to the downside.
If the price breaks down, the closest support area is found around $5,700.
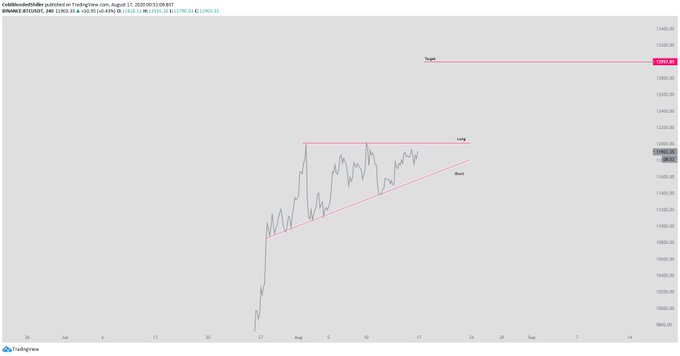
Bitcoin Chart By Trading ViewIn the very short-term, the price has created a rough outline of a head and shoulders pattern. If this pattern is valid, the price is in the process of creating the right shoulder, while the neckline of the pattern is found at $6,550.
This is also a bearish pattern that confirms the belief that the price is likely to break down.
Bitcoin Chart By Trading View Long-Term OutlookA look at the weekly time-frame reveals the main resistance level that the price has yet to flip at $6900. In addition, just by looking at the size of the current two weekly candlesticks relative to the previous bearish ones, we can see that this is much more likely to be a retracement before the beginning of a new upward movement.
Until the price is able to reach a weekly close above this $6,900 level, the directional bias remains bearish.
Bitcoin Chart By Trading ViewTo conclude, the BTC price has made several unsuccessful attempts at breaking out above the $6,900 resistance level. It has created a short-term bearish pattern and looks likely that the price will break down.
For those interested in BeInCrypto’s previous Bitcoin analysis, click here.
The post Bitcoin’s Possible Head-and-Shoulders Pattern Could Trigger a Retreat Back to Support appeared first on BeInCrypto.
origin »Bitcoin price in Telegram @btc_price_every_hour
Bitcoin (BTC) на Currencies.ru
|
|