2023-8-23 14:53 |
Bitcoin price has formed a double-top pattern on the daily chart.
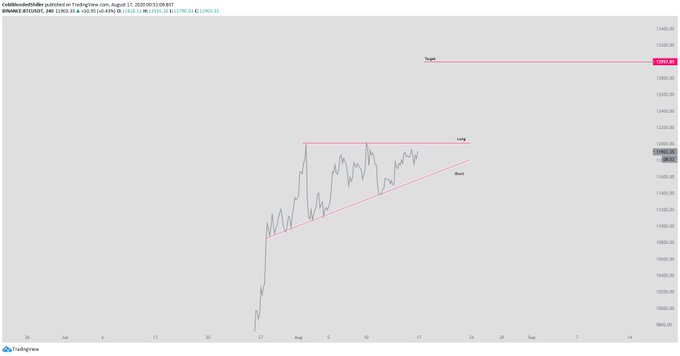
It has also formed a bearish flag pattern on the four-hour chart.
Bitcoin price remained in a tight range this week as concerns about the industry continued. The BTC/USD pair was trading at 26,000, where it has been in the past few days. Similarly, the BTC/GBP was stuck at 20,522, which was much higher than last Friday’s low of 19,762.
Bitcoin flash crashBitcoin and other cryptocurrencies continued plunging last week as concerns about the industry rose. As it dropped, Bitcoin moved below the important support at $28,300, where it failed to move below in July.
There are numerous reasons for the crash. Technically speaking, Bitcoin formed a double-top pattern, which is one of the most accurate bearish signs in the market.
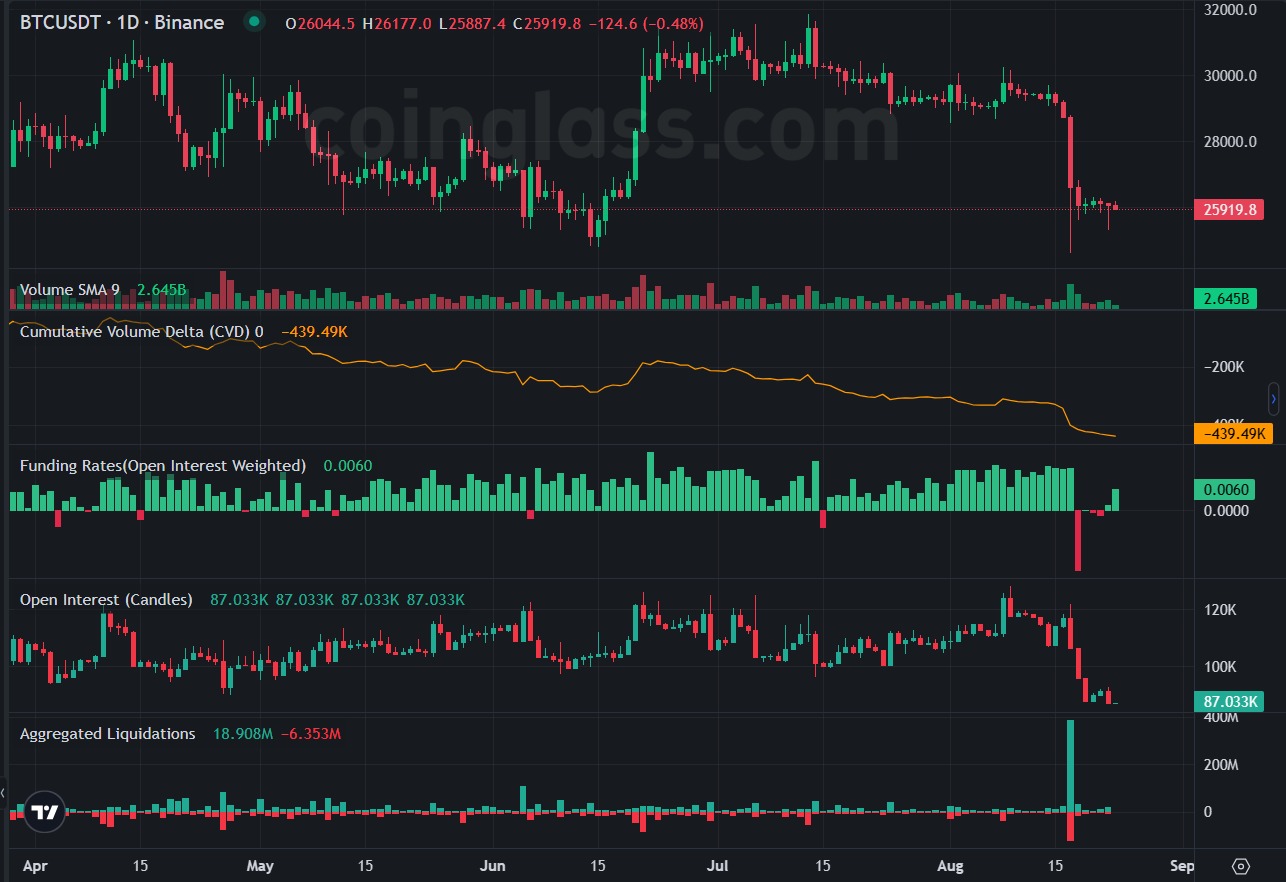
At the same time, analysts cite the performance in the derivatives market. Data compiled by CoinGlass showed that open interest worth over $2.5 billion was cleared in a few hours.
This perforance is notable since implied volatility in the options market had crashed to an all-time low earlier tis month. This volatility has now somewhat recovered following the recent plunged.
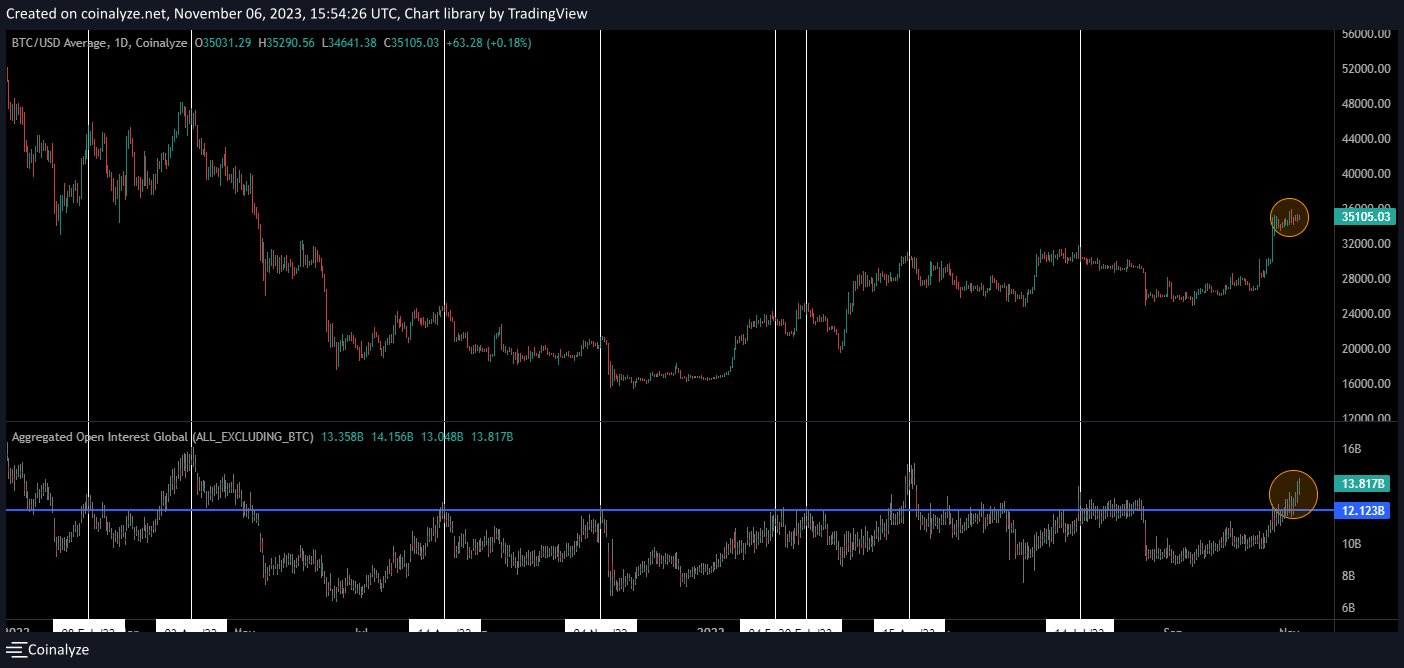
As shown below, cumulative volume delta (CVD) has been in the green in the past few days. Weighted open interest has risen while aggregated liquidations have remained substantially low.
Looking ahead, the next likely catalyst for Bitcoin price will be the upcoming meeting at Jackson Hole in Wyoming. This is an annual meeting of central bank officials from around the world. Jerome Powell and other officials will talk about the current state of the economy and the potential actions.
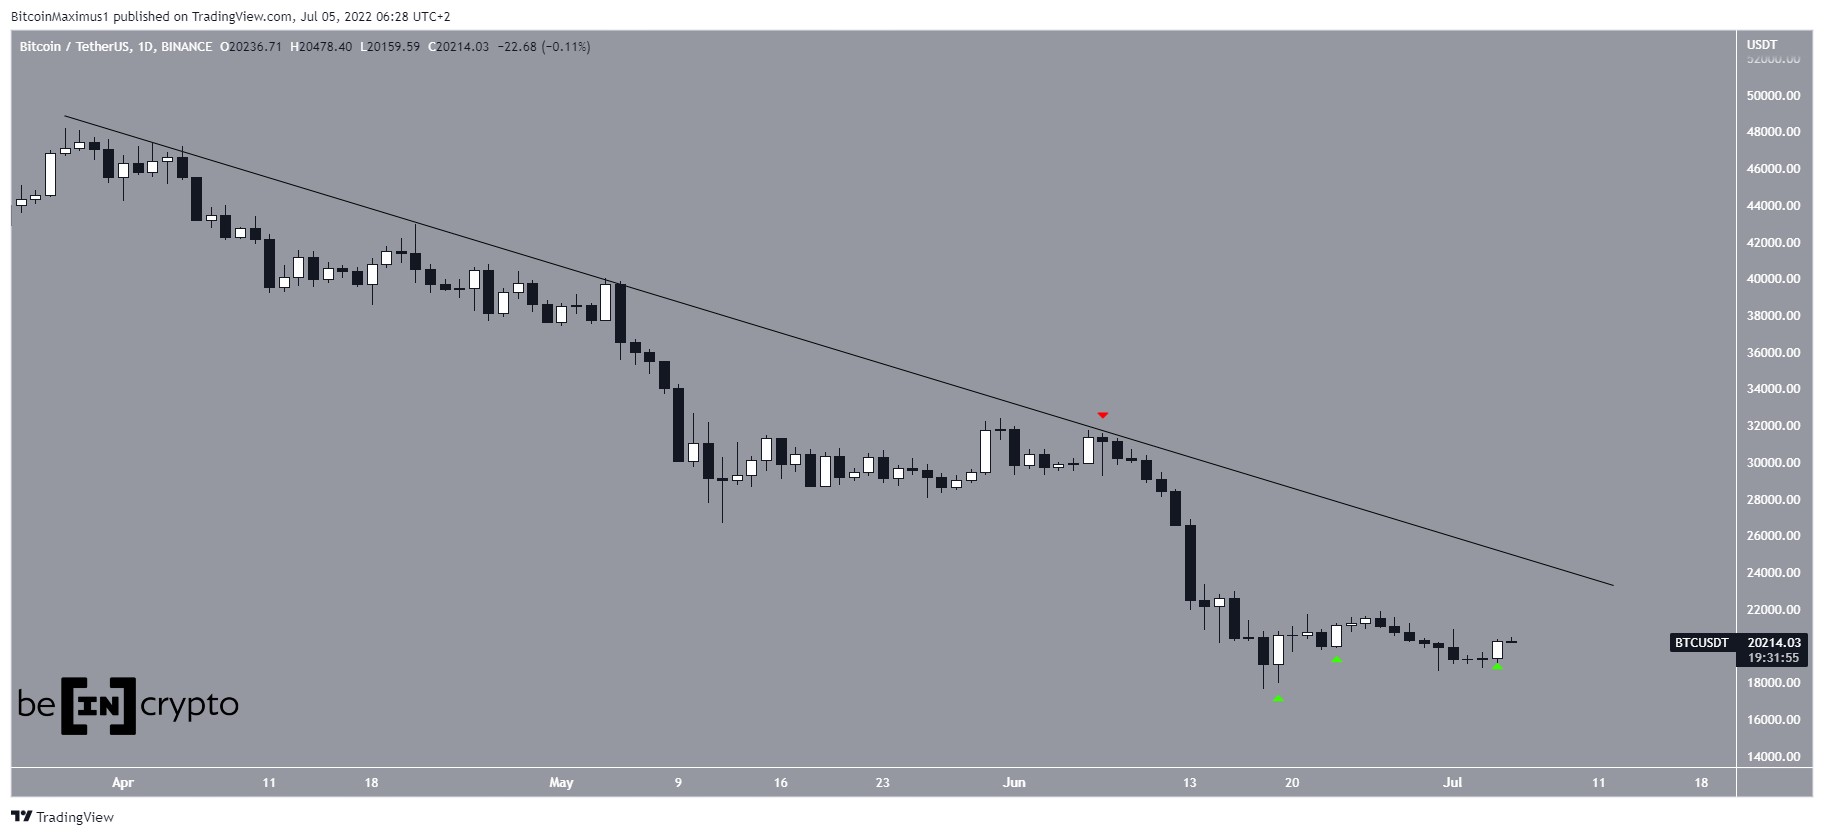
Bitcoin price forecastThe 4H chart shows that the BTC/USD pair has been in a strong bearish trend in the past few months. The chart shows that Bitcoin has moved below the 50-period and 25-period exponential moving averages (EMA).
Most importantly, Bitcoin price has formed a bearish flag pattern. In price action analysis, this pattern is usually a bearish sign. Therefore, there is a likelihood that Bitcoin price will have a bearish breakout in the coming days, with the next level to watch being at $25,000.
How to buy BitcoineToro
eToro is a multi-asset investment platform with more than 2000 assets, including stocks, ETF’s, indices, commodities and Cryptoassets. eToro offers over 60+ Cryptoassets to invest or invest in their CryptoPortfolio where investors can benefit from the accumulated growth of Bitcoin, Ethereum, XRP, Litecoin and other leading cryptocurrencies. eToro users can connect with, learn from, and copy or get copied by other users.
Buy BTC with eToro today Disclaimer Skilling EUSkilling is a regulated Forex and CFD broker that allows traders to access 800+ financial instruments, including 10 popular cryptocurrency CFDs with competitive pricing and fast execution time. Skilling offers a selection of trading platforms, including the proprietary Skilling Trader and popular, industry renown cTrader and MetaTrader 4 platforms, which can suit the needs of customers with different levels of trading experience.
Buy BTC with Skilling EU today DisclaimerThe post Bitcoin price prediction: A very dangerous pattern is forming appeared first on CoinJournal.
origin »Bitcoin price in Telegram @btc_price_every_hour
ETH/LINK Price Action Candlestick Set (LINKETHPA) на Currencies.ru
|
|