2022-7-5 10:30 |
Bitcoin (BTC) has created a bullish pattern and its first higher low since June 18. The daily RSI has yet to confirm the bullish trend reversal.
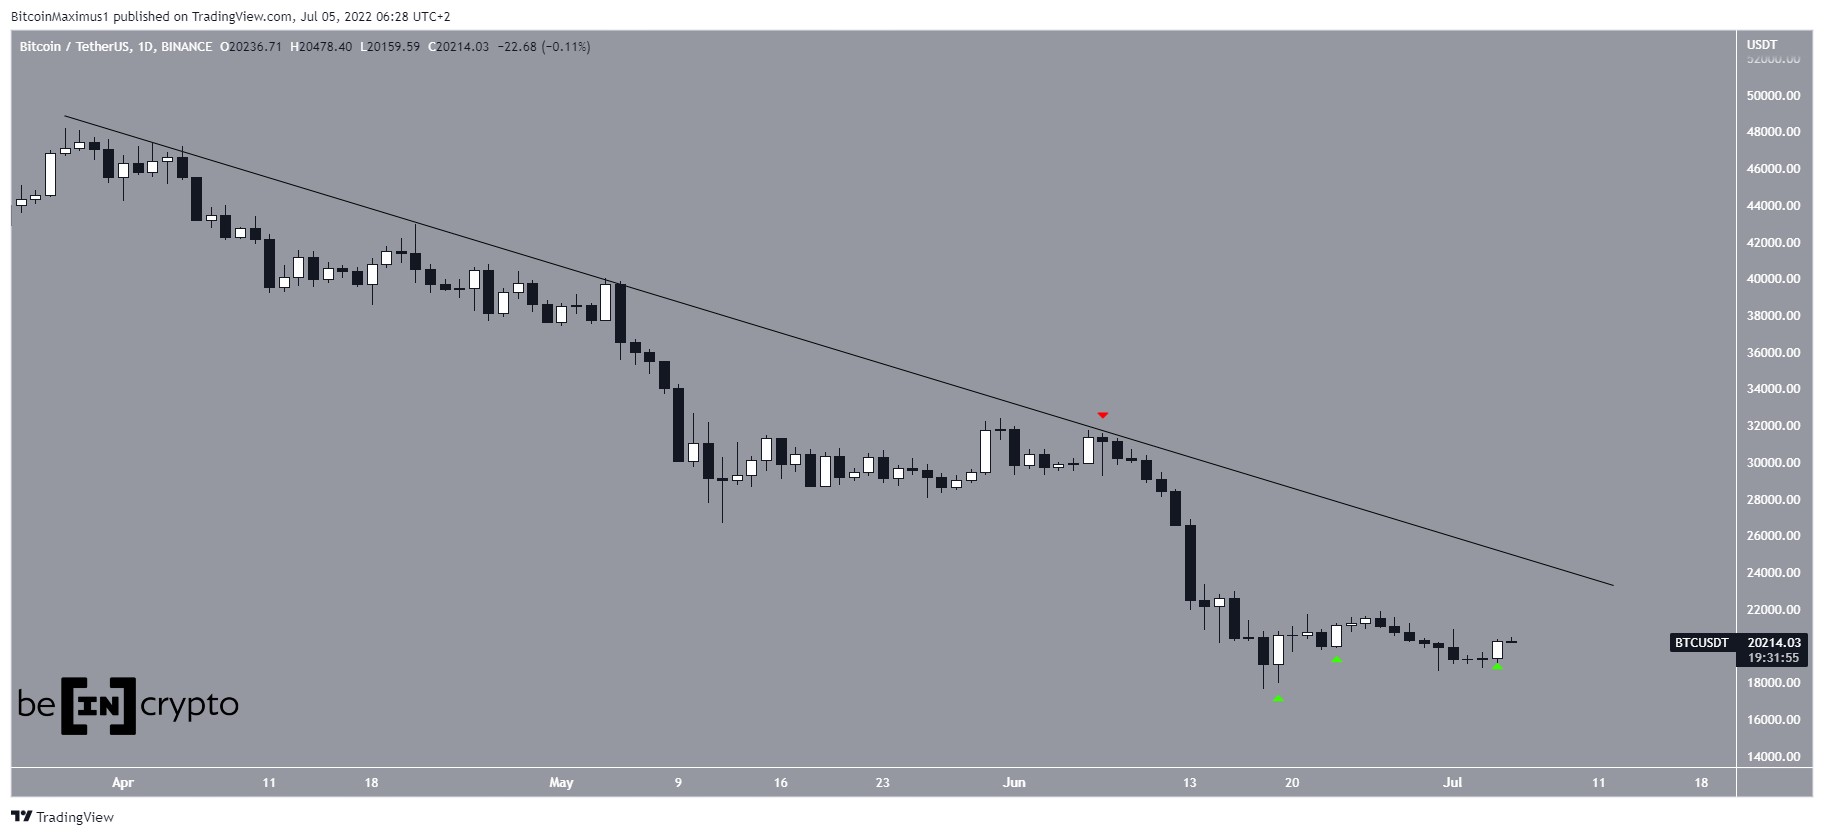
BTC has been falling underneath a descending resistance line since April 5. The line most recently caused a rejection on June 7 (red icon), leading to a low of $17,622 on June 8.
The price has increased slightly since, and is currently trading just above $20,000. A bullish development is the creation of three bullish candlestick patterns, on June 19, 23 and July 4, respectively (green icons).
If the upward movement continues, the aforementioned resistance line would be at $20,200.
BTC/USDT Chart By TradingView Potentially bullish RSIA closer look at the daily movement shows a potential double bottom pattern that has been created between June 18 and July 3 (green icons), with the second bottom being a slightly higher low. The double bottom is considered a bullish pattern.
Furthermore, the pattern has been combined with bullish divergence in the RSI. If the RSI were to break out from its descending resistance line and then move above 50, it would confirm that the trend is bullish. This would be expected to lead to a breakout from the long-term descending resistance line.
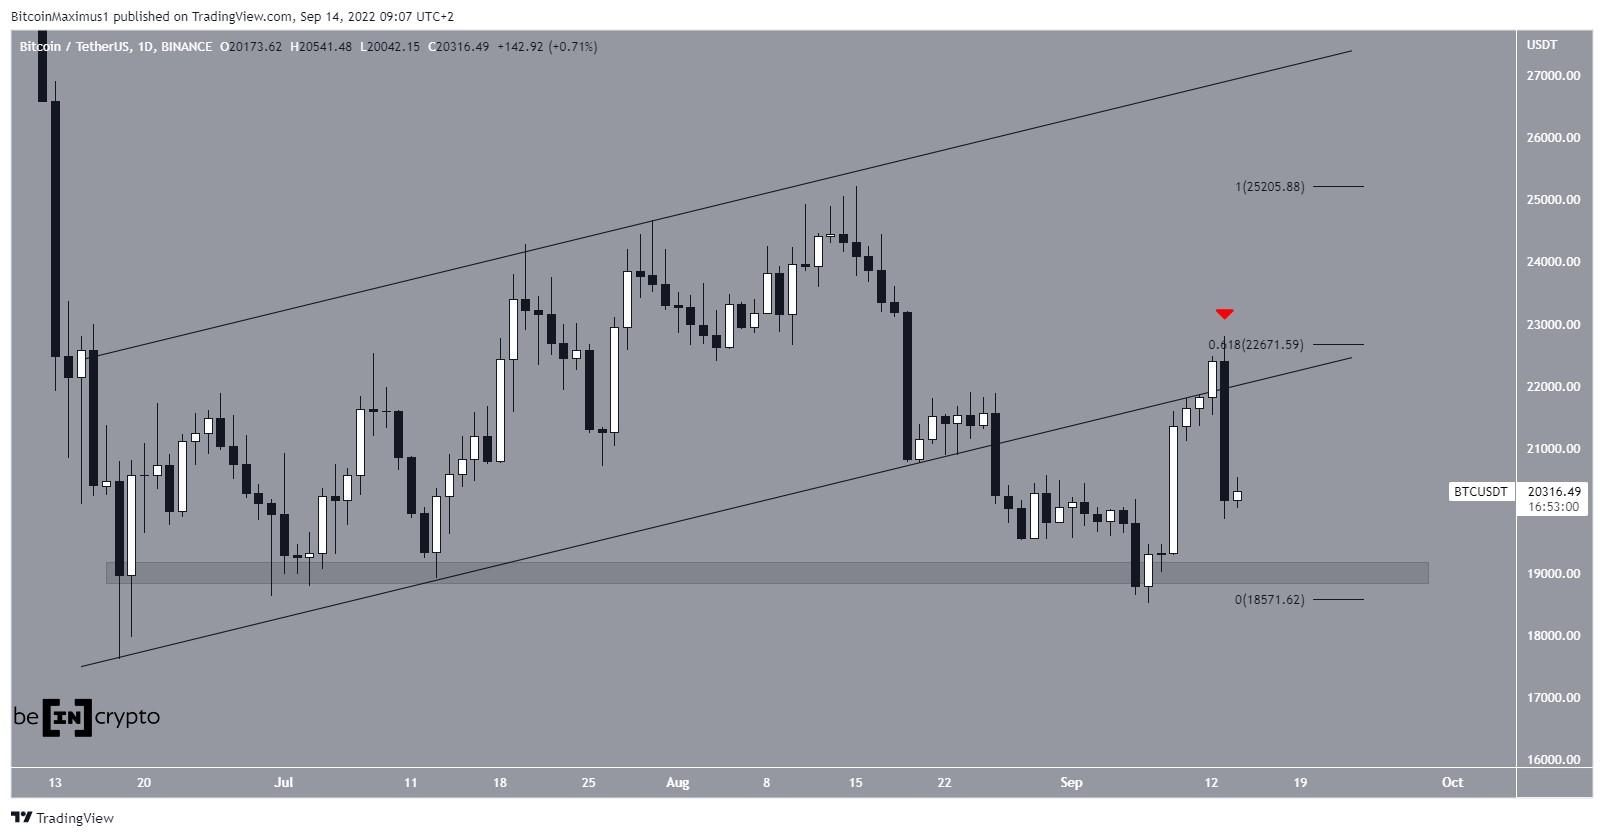
BTC/USDT Chart By TradingViewThe two-hour chart shows that BTC has broken out from a descending resistance line. Currently, it is attempting to move above the $20,400 horizontal resistance area. The area is between the 0.5-0.618 Fib retracement resistance levels, increasing its significance.
The two-hour RSI is above 50, supporting the continuation of the upward movement.
A breakout above the $20,400 area would be expected to take the price towards the previously outlined descending resistance line.
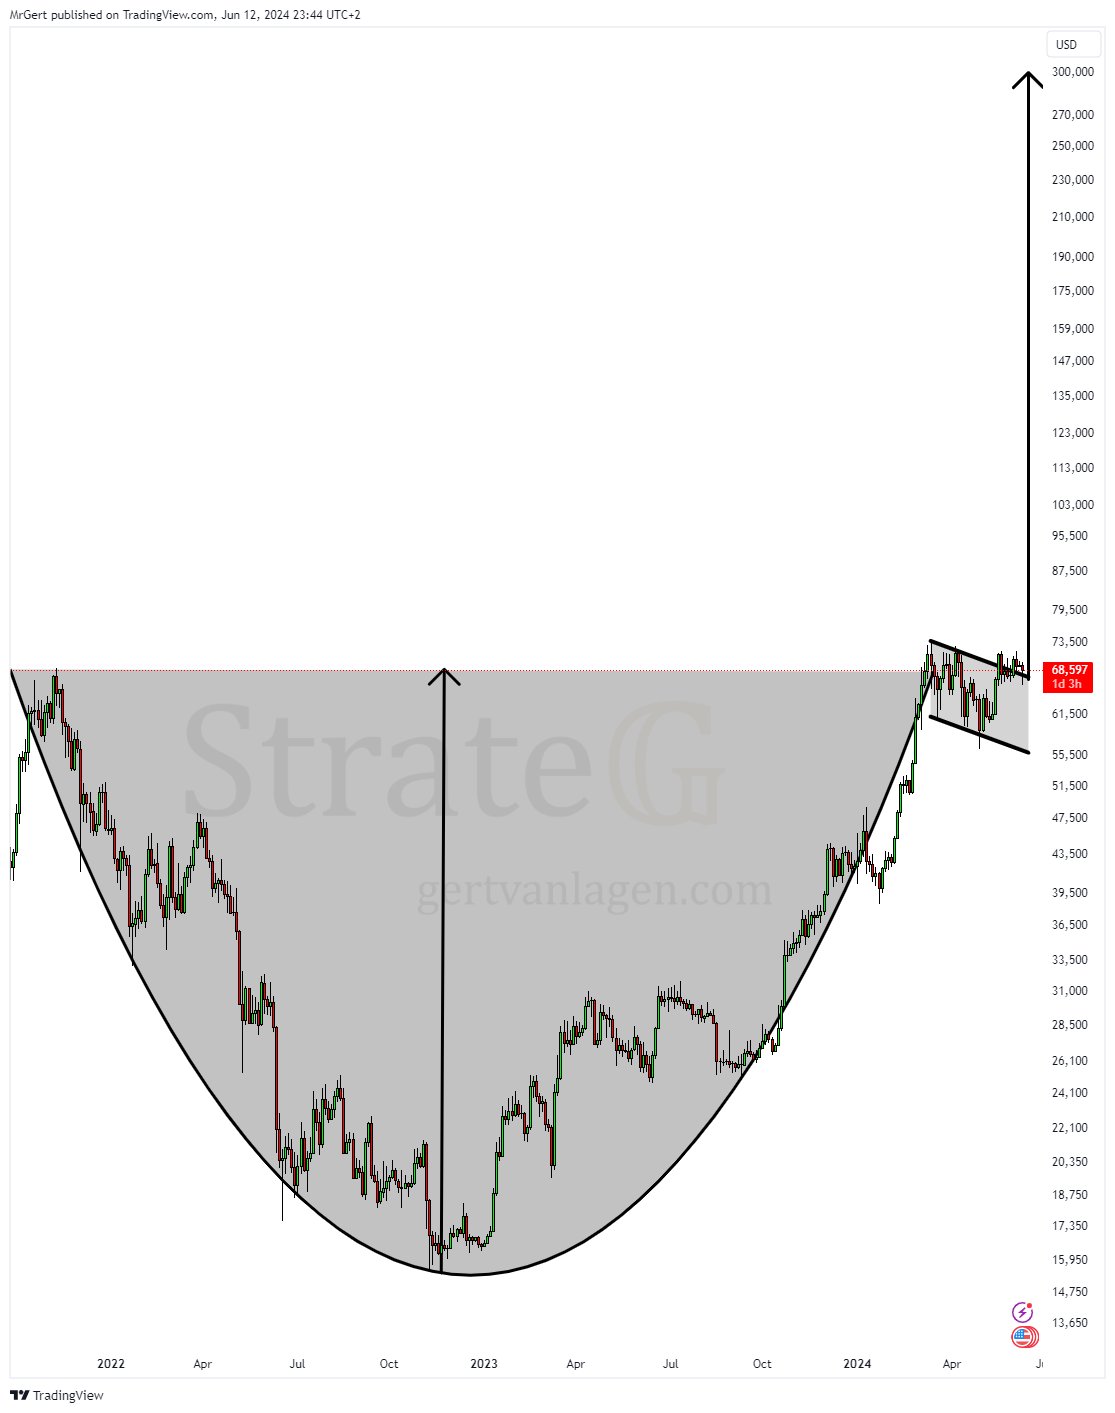
BTC/USDT Chart By TradingView Wave count analysisThe most likely long-term wave count suggests that a considerable bounce will transpire.
As for the short-term one, there are two main possibilities. The first one indicates that the price has completed a five wave downward movement (yellow), in which the fifth wave was truncated. If correct, a considerable bounce will follow.
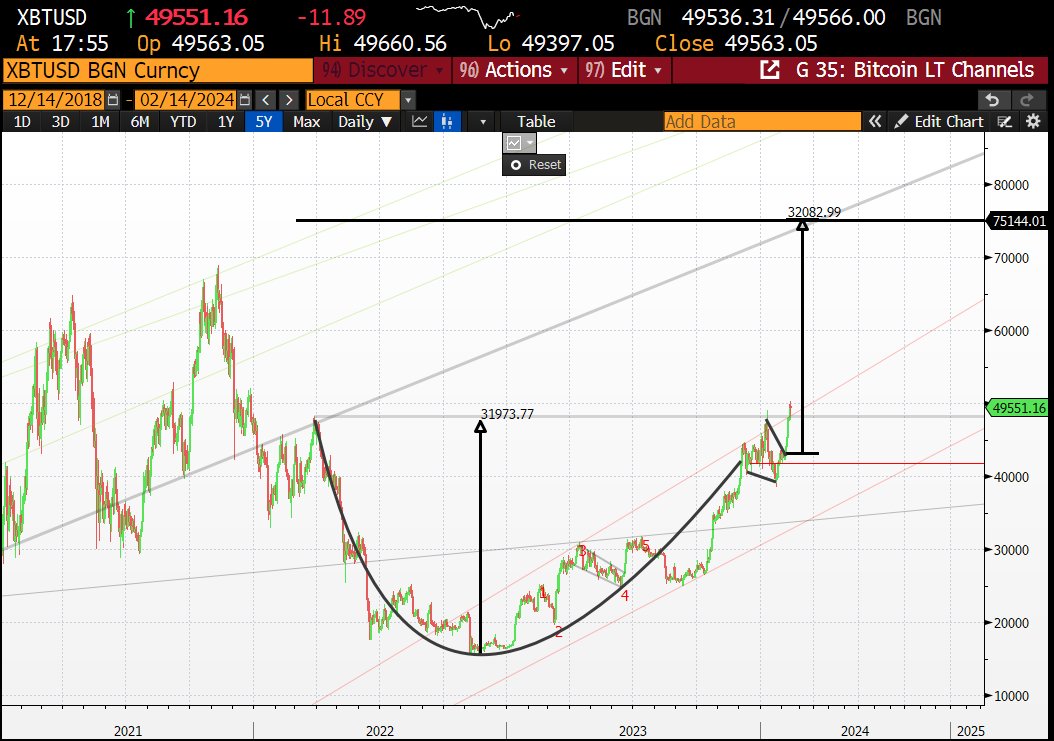
BTC/USD Chart By TradingViewThe second count also suggests that a five-wave downward movement is complete. However, instead of being truncated, the count begins at the previous lower high.
BTC/USD Chart By TradingViewWhile it initially seemed possible that BTC is still in wave four, the fact that wave four would be more than three times the length of wave two makes this highly unlikely.
So, an increase towards the long-term descending resistance line seems to be the most likely scenario.
BTC/USD Chart By TradingViewFor Be[in]Crypto’s previous bitcoin (BTC) analysis, click here
The post Bitcoin (BTC) Creates Double Bottom Pattern at $19,500 appeared first on BeInCrypto.
origin »Bitcoin price in Telegram @btc_price_every_hour
Bitcoin (BTC) на Currencies.ru
|
|