2025-7-28 23:30 |
Injective price is showing signs of a possible trend reversal as it trades just below a key breakout zone. Technical analysts are monitoring the daily chart for confirmation of an inverse head and shoulders (H&S) pattern.
At the same time, traders on X are pointing to a tightening price range that may lead to increased volatility.
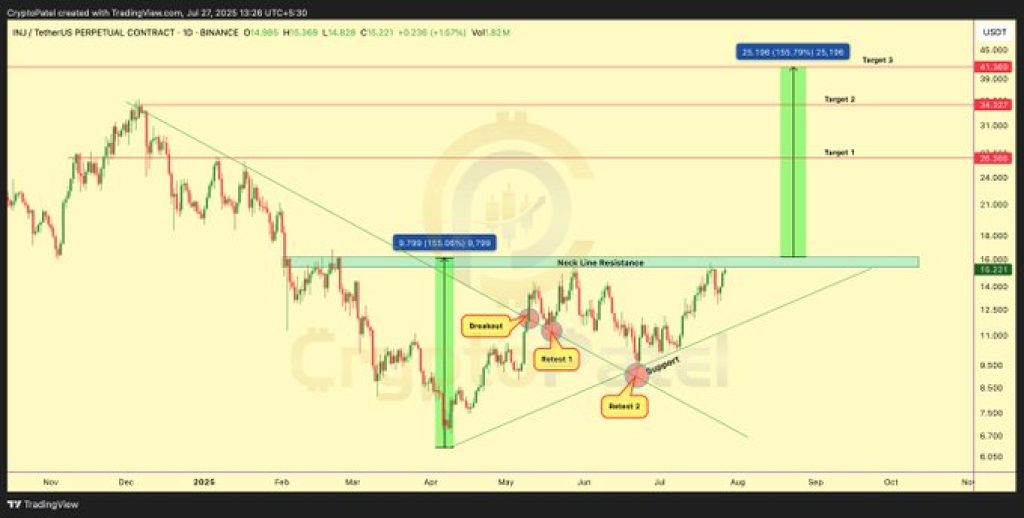
Top analyst Crypto Patel shared that INJ price is forming a textbook inverse H&S pattern with a neckline resistance near $16.20.
He noted that a daily close above this level could confirm the breakout, with upside targets mapped out at $26.36, $34.32, and $41.36. Until confirmation, the range remains an accumulation zone with invalidation near $12.
INJ Chart Structure Suggests Breakout SetupThe daily chart reflects a classic inverse H&S structure with three defined parts: a left shoulder in early April, a head in mid-April near $8.50, and a right shoulder forming from late May into July. The neckline sits flat around $16.20, a level the INJ price has tested multiple times but not yet closed above.
Volume has remained consistent through the consolidation, while the rising trendline support from the April lows has held. As long as INJ continues to respect that upward structure, the setup remains active.
Image Source: X/CryptoPatel Key Injective Price Levels in FocusA confirmed breakout requires a daily candle close above $16.20. If this happens, the depth of the head to neckline, around $7.70, would project price targets up to $41.36.
The targets have been calculated using Fibonacci extensions, with $26.36 and $34.32 serving as intermediate resistance zones.
Failure to hold the rising trendline and a break below $12 would invalidate the bullish setup. That level now acts as the critical support zone on the downside.
Read Also: Here’s Why Pump.Fun (PUMP) Price Is Pumping Today
Injective Price Accumulation Zone Nears Compression EndINJ is compressing in a tight range under the neckline. This zone has seen increased buying interest, as shown by previous retests. Traders are closely watching the daily close to confirm directional bias.
As INJ price continues to build pressure, market participants await either a breakout toward the projected targets or a failure that could shift sentiment back to neutral.
Subscribe to our YouTube channel for daily crypto updates, market insights, and expert analysis.
The post This Injective (INJ) Price Chart Pattern Could Trigger a 3x Move – Here’s the Setup appeared first on CaptainAltcoin.
origin »Bitcoin price in Telegram @btc_price_every_hour
ETH/LINK Price Action Candlestick Set (LINKETHPA) на Currencies.ru
|
|