2023-7-18 01:19 |
Bitcoin price is pulling back after a strong finish in the crypto market last week. However, this past Sunday night’s weekend close was also the close of the 4-week BTCUSD chart, which has potentially confirmed a high timeframe continuation pattern.
If the continuation pattern is indeed valid, it could point to 3-6 months of an extended uptrend, making 2023 an extremely bullish year in the end. Here is everything you need to know about the bullish continuation pattern and what it could mean for the crypto market.
Bullish Candlestick Continuation Pattern To Light Up Second Half Of 20232023 has been an interesting year in the cryptocurrency market. Bitcoin has been mostly bullish, but nothing compared to what we’ve witnessed in the past — as recently as 2020. Meanwhile, altcoins have been long suffering an onslaught from the US SEC. This has kept Bitcoin further at bay against the US Dollar, while eating up altcoin capital on the BTC pair.
Despite an important week for the industry and BTCUSD setting a new high for the year, Bitcoin lost some momentum and is now trading below $30,000 per coin. However, before the correction happened, the 4-week BTCUSD candle also closed on Sunday night.
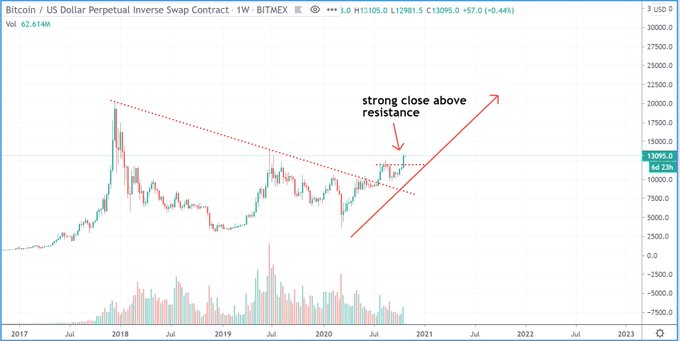
The 4-week timeframe is slightly more sensitive than the monthly at between 2 to 3 days less, sometimes offering unique signals from the 1-month. Sunday night’s close forever marked the chart with the last candle necessary for a completed Rising Three Method pattern.
The Rising Three Method is a bullish Japanese candlesticks continuation pattern. It consists of a large white candle, followed by three small-bodied candles in a row. After the period of consolidation, a large white candle closes above the trio of black candles, engulfing them all.
Bitcoin Buyers Make A Statement: Rising Three Method Pattern CompletesThe pattern shows that after a pause, buyers resume control. By making this statement, bulls could gain control of Bitcoin over the next 3 to 6 months. The reason for the timing, is due to the length of each candle’s session. After a Japanese candlestick pattern confirms, its expected results should appear within the next 3-5 candlesticks. 3-5 sessions of 4 weeks total, equals roughly 12 to 20 weeks, or around 3-5 months.
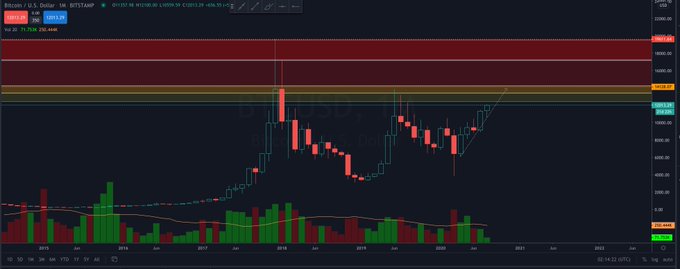
That timing would take any potential bull rally through the end of the year. For further validation of the fact upside should appear within 3-5 candles after a confirmed signal, we can see that a morning star pattern completed during the first candlestick close of the year. The second candle of the year was a doji, then this bullish continuation pattern formed. All of this combined tells a possible story of a continued bull market for the rest of the calendar year.
The Japanese candlestick continuation pattern also comes with plenty of confluence through a confirmed bullish crossover of the LMACD. The technical indicator suggests a momentum shift supportive of more upside in Bitcoin.
Will this continuation pattern result in a strong bull market breakout?
This chart originally appeared in issue #12 of CoinChartist (VIP) alongside a dozen exclusive XRP, Bitcoin, and other charts. Subscribe for free.
origin »Bitcoin price in Telegram @btc_price_every_hour
Bitcoin (BTC) на Currencies.ru
|
|