Новости о Pattern Chart [ Фото новости ] [ Свежие новости ] | |

Buy LTC/USDT opportunity: riding the upward momentum in Litecoin
LTC/USDT chart and technical analysis LTC/USDT is turning bullish after the price made inverse head and shoulder pattern and closed above the major resistance level of 63. 01. Price is making correction after it closed above the previous high. дальше »
2023-9-22 19:32 | |
|
|
Jasmy Coin price descending triangle points to more downside
Jasmy price has formed a descending triangle pattern on the daily chart. Focus now shifts to the upcoming Federal Reserve interest rate decision. Jasmy coin price has moved sideways in the past few days even as other cryptocurrencies have bounded back. дальше »
2023-9-20 17:59 | |
|
|
Binance coin (BNB) signals buy opportunity against USDT
BNB/USDT chart and technical analysis BNB/USDT is recovering from the major drop in the last couple of months. Price is indicating a bullish trend in making. The appearance of a bullish head and shoulder pattern is a clear indication of the coming uptrend. дальше »
2023-9-17 16:51 | |
|
|
Riot, MARA, Argo Blockchain stocks at risk as BTC forms death cross
Bitcoin mining stocks have dropped sharply from their highest levels this year. Bitcoin price is about to form a death cross pattern on the daily chart. The US dollar index is forming a golden cross pattern. дальше »
2023-9-8 18:45 | |
|
|
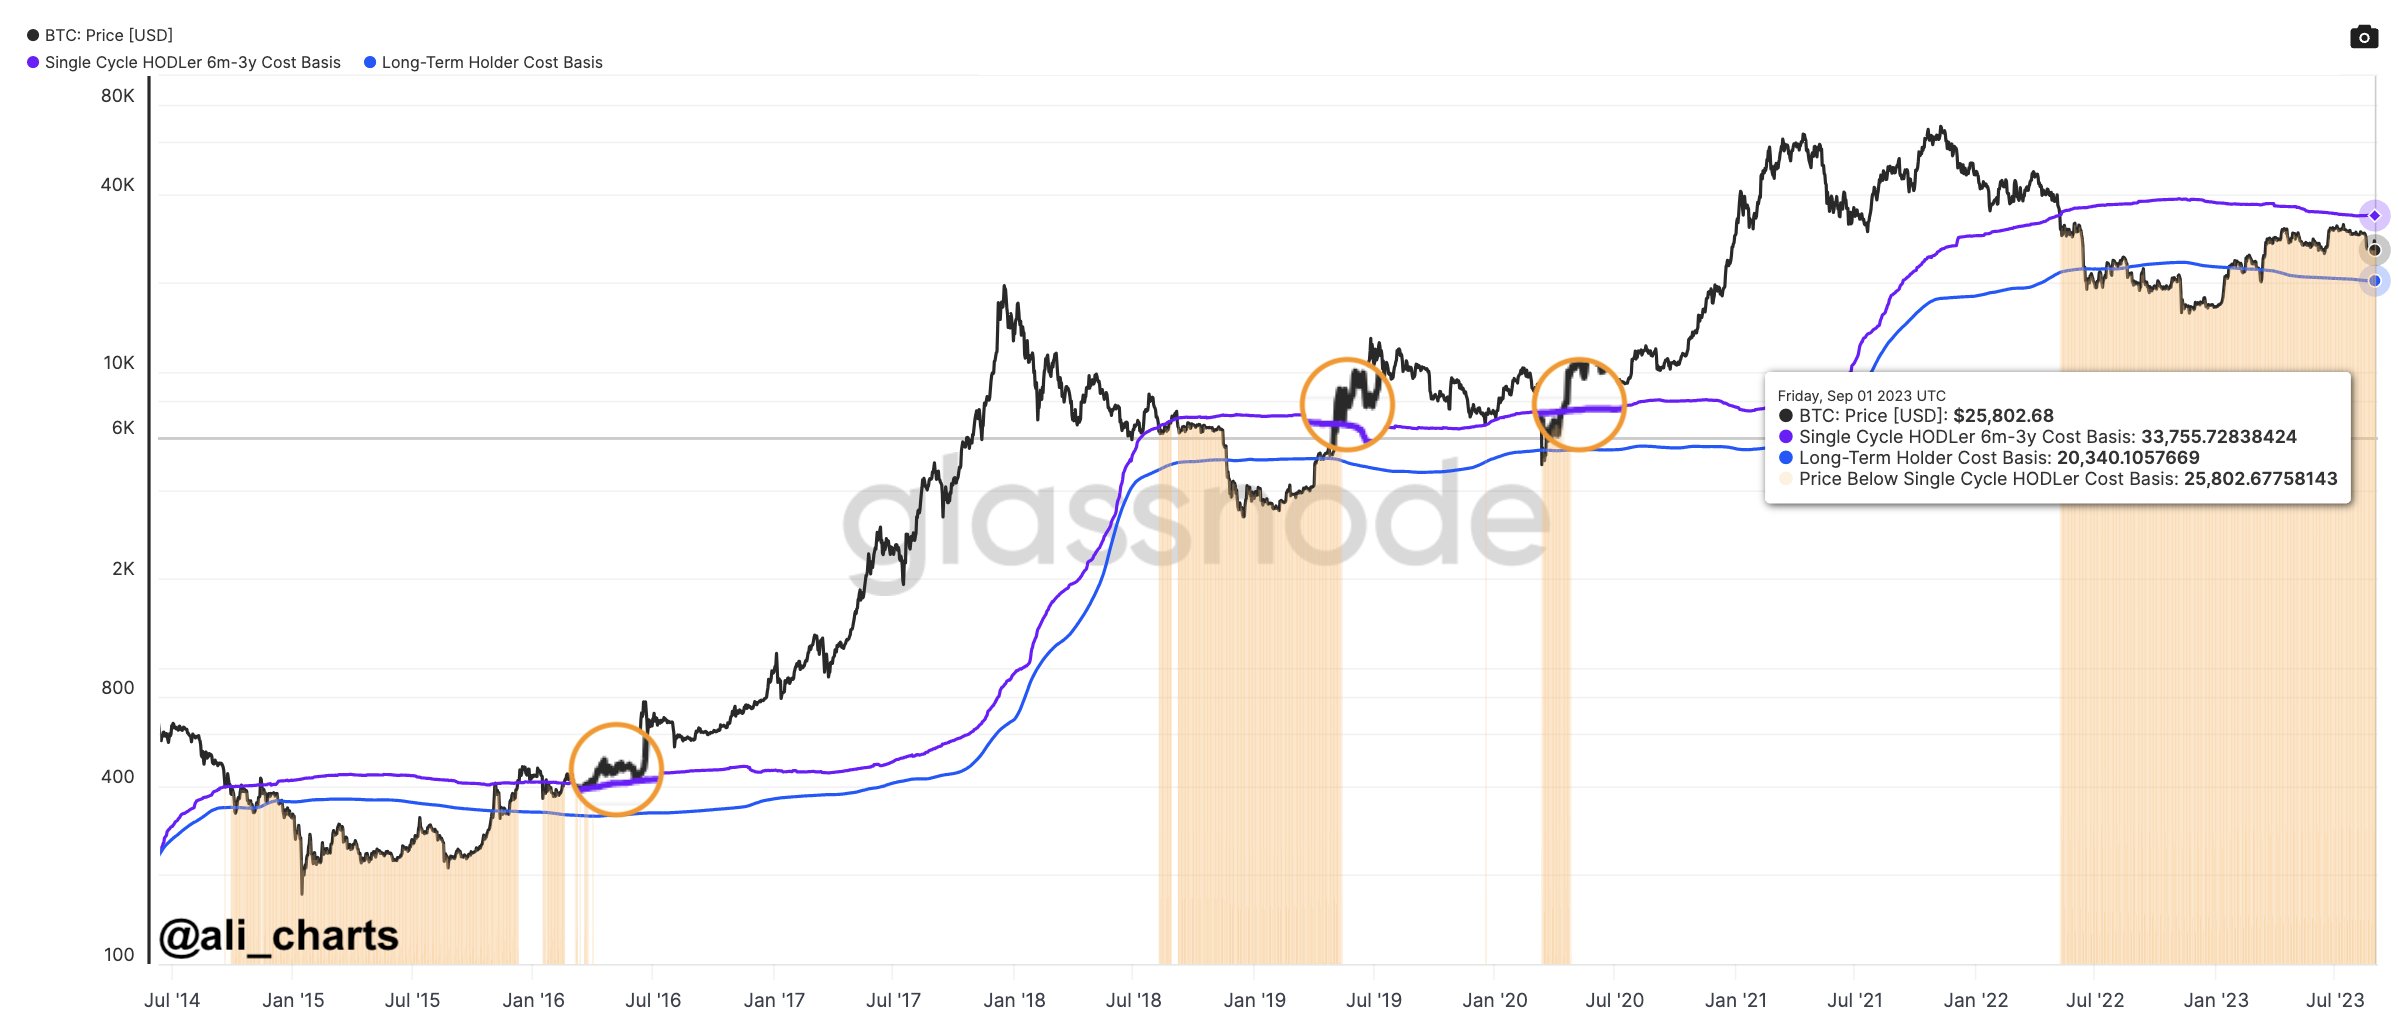
Here’s What Will Happen If Bitcoin Can Break $33,700
On-chain data suggests the $33,700 level could be a very significant level to break for Bitcoin if the historical pattern is anything to go by. Bitcoin 6 Months To 3 Years Old Investors Have $33,700 As Cost Basis In a new post on X, Ali, an analyst, has shared a chart that could shed light on the path that BTC may end up taking. дальше »
2023-9-6 20:00 | |
|
|
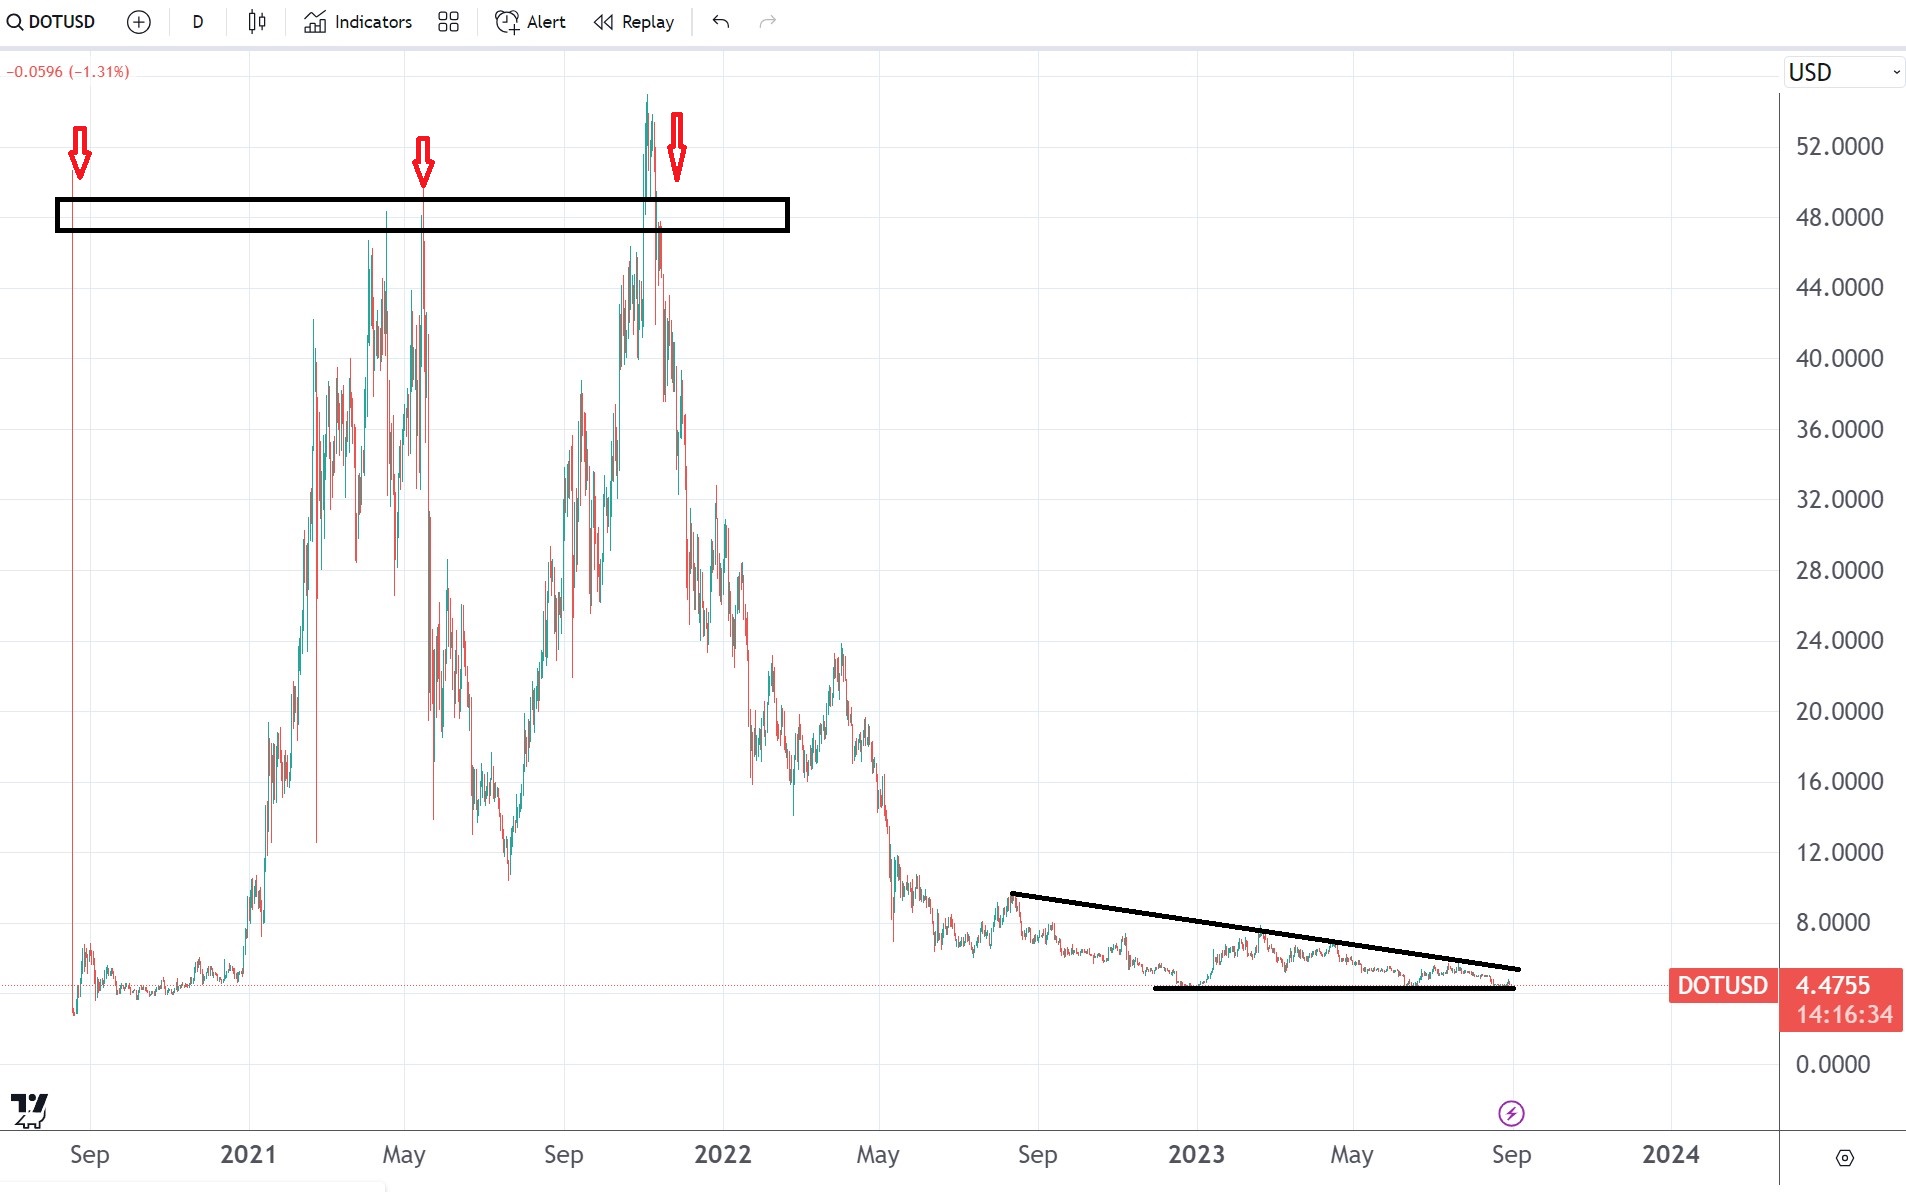
DOT/USD price forecast: A descending triangle keeps bulls at bay
DOT/USD is in a triangular consolidation The bias remains bearish Conservative traders might want to wait for the market to move first There is nothing positive in the DOT/USD chart for bulls. The price action remains constrained by a triangular pattern that formed in the last twelve months. дальше »
2023-8-31 13:00 | |
|
|
Fetch.ai (FET) Trading Pattern Reveals Potential for $4.45 – But There’s a Catch
Crypto enthusiasts have lately been buzzing about Fetch. ai ($FET), a decentralized machine learning platform that has been showing some strong indicators on its trading charts. After forming a double bottom pattern on the daily chart and flipping its 200-day exponential moving average (200EMA), $FET is now positioned for a short-term price target between $0. дальше »
2023-8-31 12:00 | |
|
|
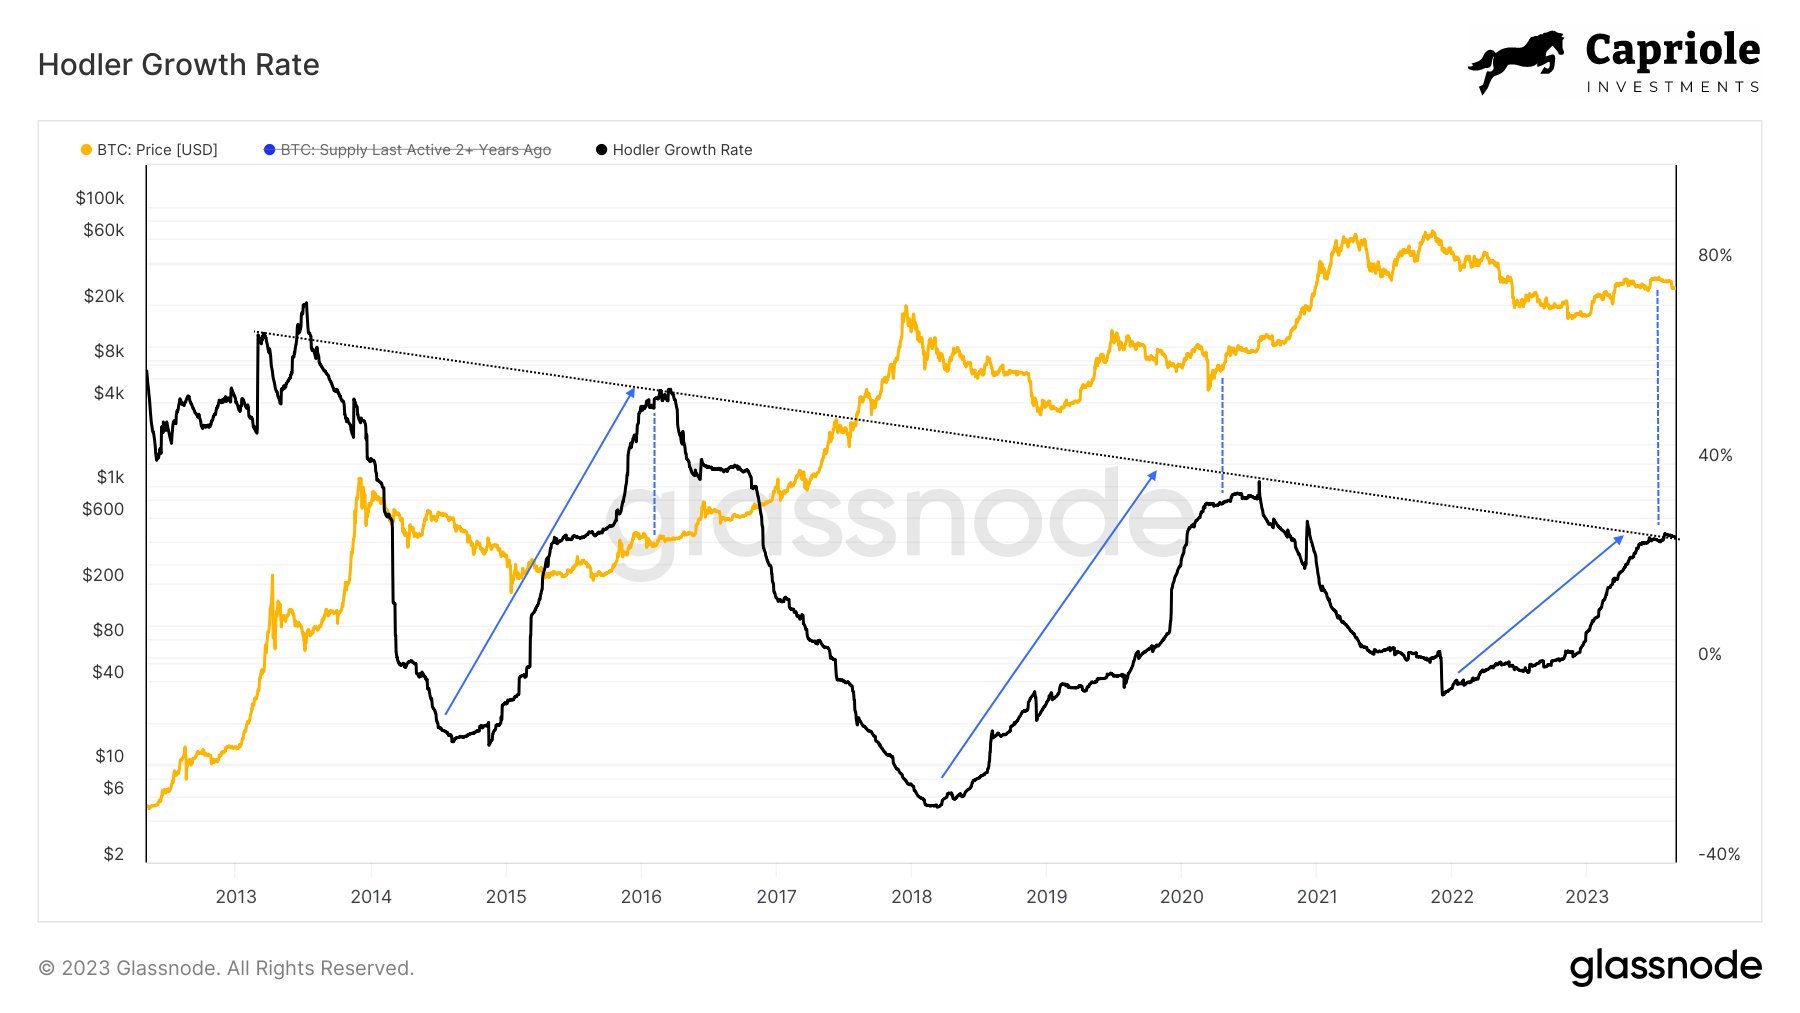
Bitcoin Bull Run Incoming? This Metric Could Suggest So
On-chain data shows a Bitcoin metric is forming a pattern that may hint that a bull run could be coming next for the asset. Bitcoin HODLer Growth Rate Has Seemingly Reached The “Plateau” Stage In a new post on X, the analyst Charles Edwards shared a chart highlighting a pattern that the BTC “HODLer Growth Rate” indicator may be forming. дальше »
2023-8-29 23:00 | |
|
|
Analyst Says Woo Network (WOO) Primed To Erupt After Spotting Rare Trading Pattern
Last week, Rekt Capital delved into the intricate details of the triangular market structure that has been forming in WOO’s price chart. According to Rekt Capital, this structure serves as more than just a pattern; it’s a historical indicator that often provides clues about future price movements. дальше »
2023-8-25 09:00 | |
|
|
Bitcoin price prediction: A very dangerous pattern is forming
Bitcoin price has formed a double-top pattern on the daily chart. It has also formed a bearish flag pattern on the four-hour chart. Bitcoin price remained in a tight range this week as concerns about the industry continued. дальше »
2023-8-23 14:53 | |
|
|
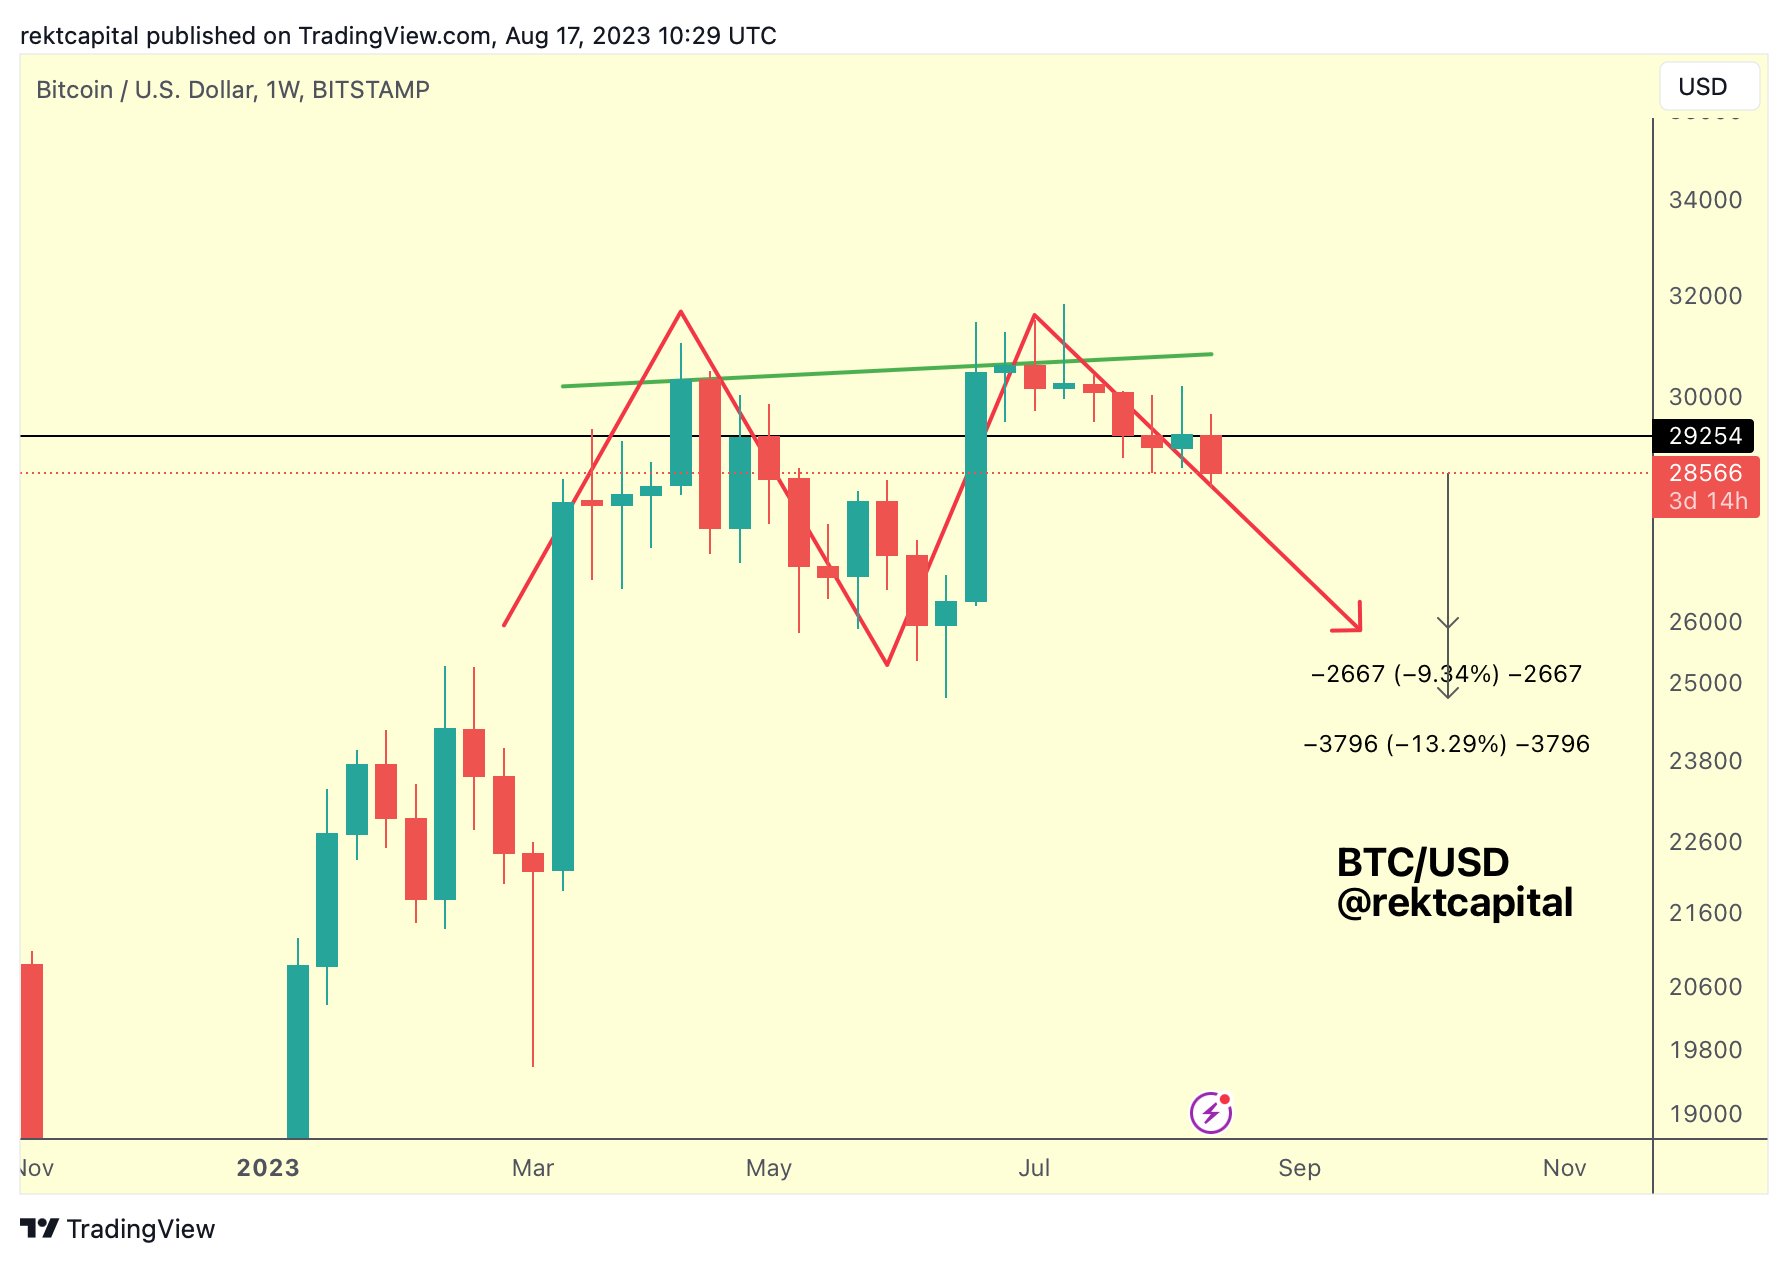
Bitcoin Faces A Weekly Double Top; This Needs To Happen
In a recent analysis of the Bitcoin price, seasoned crypto analyst Rekt Capital discussed the looming presence of a potential double top formation on the weekly chart. The scenario paints a picture of impending volatility, with both bullish and bearish narratives emerging from this often foreboding pattern. дальше »
2023-8-18 23:00 | |
|
|
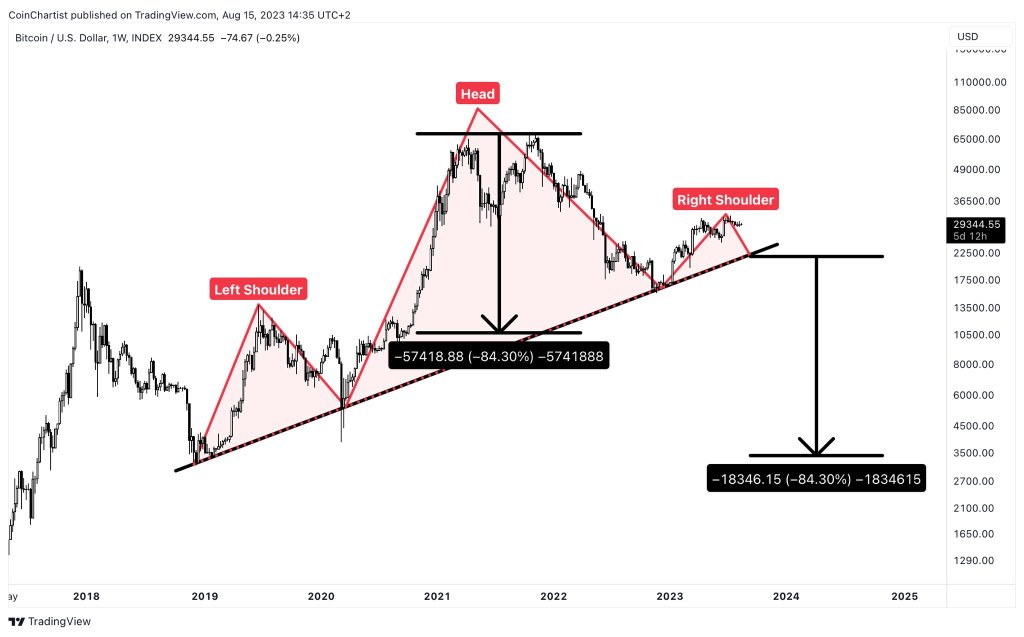
This Dreaded Candlestick Formation Just Printed: Bitcoin To $18k?
Bitcoin, the most valuable crypto asset, is at a critical juncture at spot rates if candlestick formation in the weekly chart is anything to go by. One analyst on X, formerly Twitter and NewsBTC Editorial Director Tony Spilotro, is sounding the alarm after picking out the bearish head-and-shoulder pattern in the weekly chart. дальше »
2023-8-16 03:00 | |
|
|
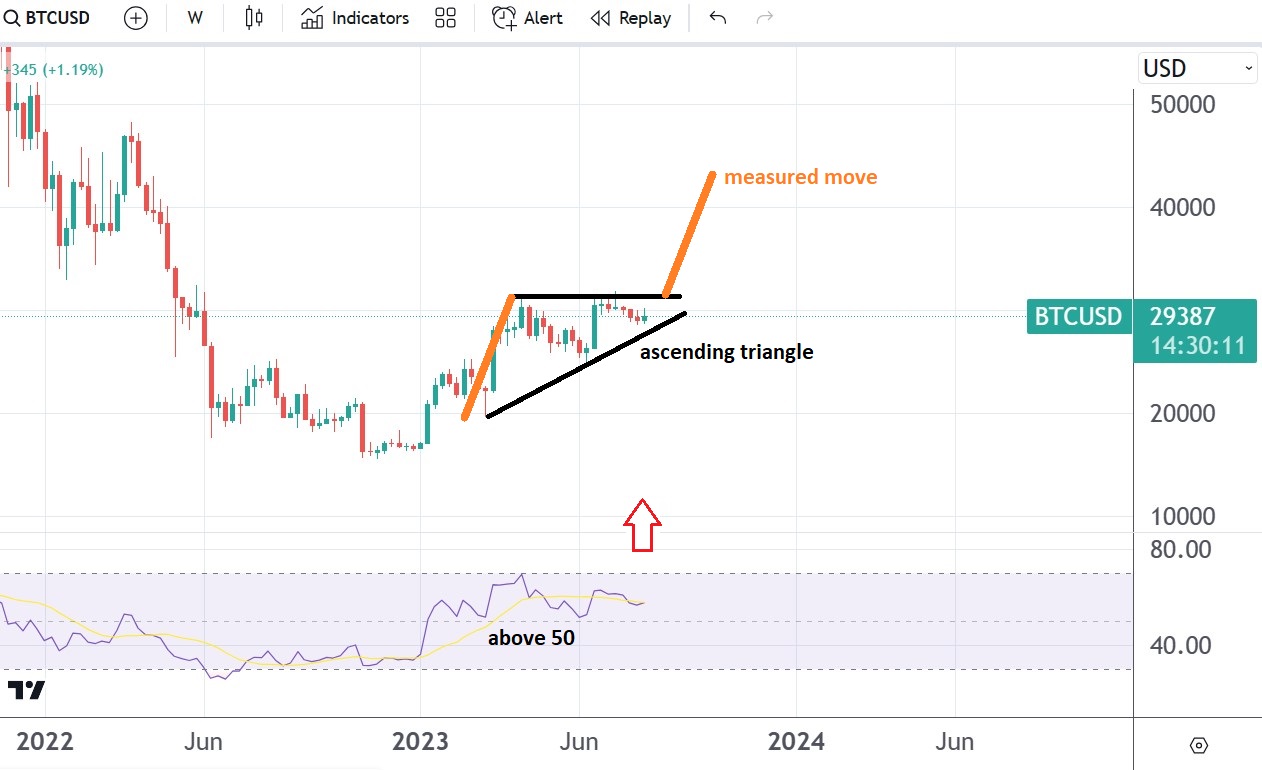
2 technical reasons to buy Bitcoin (or sell the US dollar)
RSI stays above 50 in 2023 The weekly chart points out an ascending triangle pattern $45k is the next target, providing the Bitcoin price holds above $25k Bitcoin bulls must be frustrated by the slow price action in the last few months. дальше »
2023-8-13 13:36 | |
|
|
Blast from The Past: Bitcoin Formation Echoes Livermore’s Speculative Chart
Bitcoin price has been locked in a mostly sideways pattern, sloping ever so slightly upward. The price action appears to resemble the beginning of Jesse Livermore’s famous “Speculative Chart” also referred to as an Accumulation Cylindar. дальше »
2023-8-11 01:02 | |
|
|
BTC/GBP and GBP/USD diverge after the BoE rate decision
The Bank of England delivered another interest rate hike. The BTC/GBP and GBP/USD pair diverged after the report. It has formed a bullish flag pattern on the daily chart. The BTC to GBP pair moved sideways after the latest Bank of England (BoE) interest rate decision. дальше »
2023-8-4 14:45 | |
|
|
Cup And Handle Pattern Emerges In XRP Chart: What Does It Mean?
Despite a favorable ruling as a non-security token, XRP had experienced a correction for over a week and a half, losing bullish momentum after reaching a yearly high of $0. 94. It is trading above the $0. дальше »
2023-7-29 03:00 | |
|
|
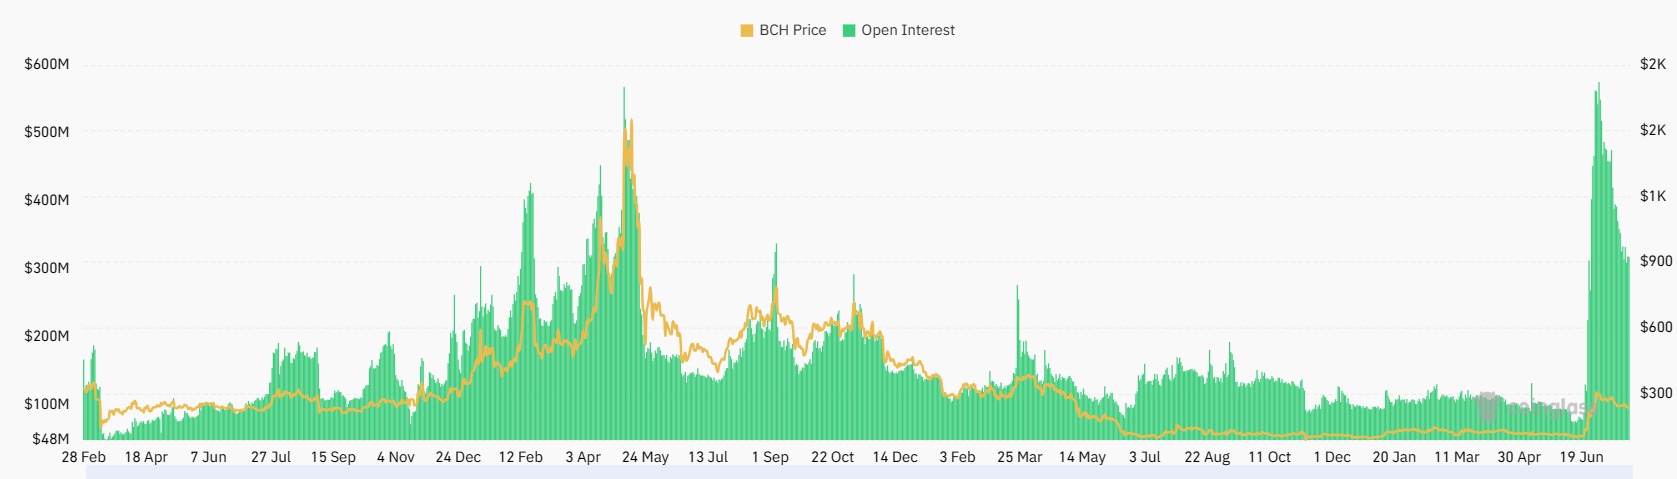
Bitcoin Cash (BCH) price forms a falling wedge: Is it safe to buy?
Bitcoin Cash price has formed a falling wedge pattern on the 4H chart. Focus shifts to the upcoming interest rate decision by the Fed. Bitcoin Cash price has retreated in the past few weeks as the recent momentum in the crypto industry waned. дальше »
2023-7-27 18:31 | |
|
|
Shiba Inu: Will This Bullish Formation Lead To A 25% Upsurge?
Shiba Inu (SHIB) has recently caught the attention of traders and investors as it forms an ascending triangle pattern on the price chart. This technical pattern is characterized by higher lows, converging with a horizontal resistance level. дальше »
2023-7-26 10:39 | |
|
|
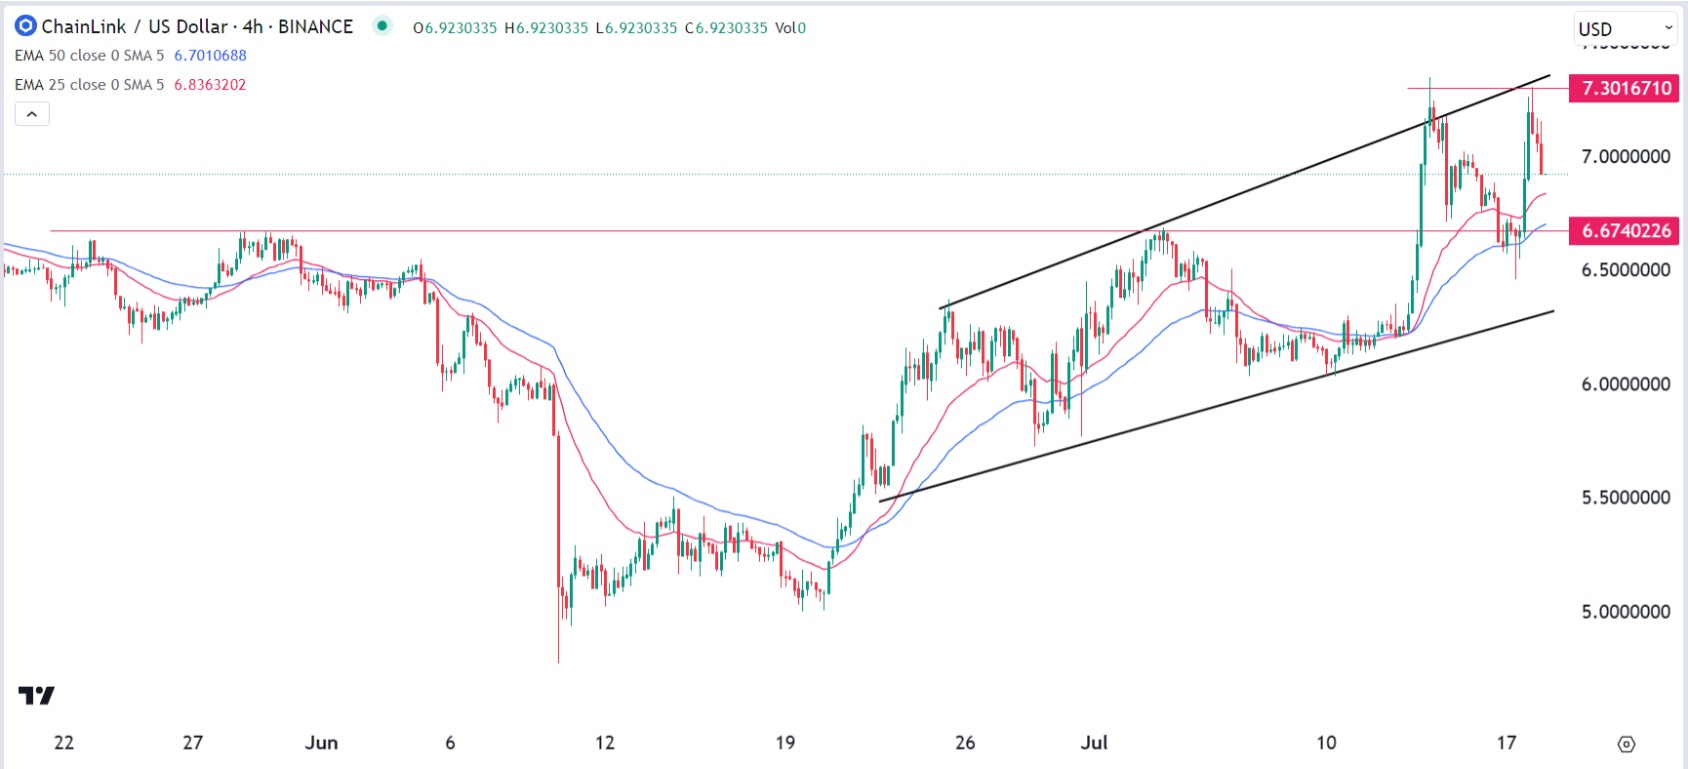
Chainlink Price Pattern Formation: What It Means For Its Price Action
In recent trading sessions, Chainlink (LINK) has exhibited a bullish trend. It experienced a significant rebound from its $5 support level and has since continued on an upward trajectory. Related Reading: Litecoin Whales Deposit Big To Exchanges, Bearish Sign? Over the past week, LINK has surged more than 12%, although its daily chart indicates a slowdown in gains. дальше »
2023-7-19 03:00 | |
|
|
This Bitcoin Continuation Pattern Points To 3-6 Months Of Uptrend Ahead
Bitcoin price is pulling back after a strong finish in the crypto market last week. However, this past Sunday night’s weekend close was also the close of the 4-week BTCUSD chart, which has potentially confirmed a high timeframe continuation pattern. дальше »
2023-7-18 01:19 | |
|
|
Binance Coin (BNB) price forms a bearish flag as the plot thickens
BNB coin has become heavily shorted in the perpetual futures market. It has also formed a bearish flag pattern on the daily chart. Binance Coin has come under intense pressure in the past few weeks as short bets in the futures market increased. дальше »
2023-7-17 15:42 | |
|
|
Ethereum Price On The Verge Of Rectangle Pattern Breakout: Is $2000 Within Reach?
Over the past few days, the Ethereum price has remained relatively stable, with minor gains seen on the daily chart. Meanwhile, Bitcoin’s indecisiveness has resulted in slower movement for altcoins. дальше »
2023-7-12 04:00 | |
|
|
Market Update: ARB To Sink, ETH At Crucial Support While DOGE & HBAR Prepare For Rallies
While Bitcoin struggles to conquer the $31k zone, other coins are battling their own wars. Starting with ARBUSDT, the chart has formed a Head and Shoulder pattern, a classic reversal pattern, and has also broken the neckline. дальше »
2023-7-5 14:09 | |
|
|
XRP Exhibits Bearish Chart Pattern – Where Could The Price Head Next?
In the past 48 hours, the price of XRP has experienced notable volatility, dropping below $0. 50. The crypto market is closely focused on XRP due to a recent favorable development in the Securities and Exchange Commission (SEC) vs. дальше »
2023-6-15 19:00 | |
|
|
Litecoin price analysis ahead of the FOMC decision, US inflation data
Litecoin has formed a triple-top pattern on the daily chart. The main news is the recent lawsuits against Coinbase and Binance. The Federal Reserve will deliver its next interest rate decision. Litecoin price has come under intense pressure in the past few days as investors focus on the recent SEC lawsuits against Coinbase and Binance. дальше »
2023-6-12 16:03 | |
|
|
Trader Predicts 60% Bitcoin Price Surge Upon Confirmation of ‘Textbook’ Chart Pattern
Bitcoin (BTC) is currently trading at $26,605, and according to a popular trader named Mikybull Crypto, it may be poised for a significant upside of 60% if a particular long-term chart pattern holds true. дальше »
2023-6-10 18:27 | |
|
|

Bitcoin price can gain 60% if ‘textbook’ chart pattern confirms — Trader
Bitcoin is attempting to cement an inverse head-and-shoulders pattern, which could spark a “sprint” to $40,000.
дальше »2023-6-9 12:15 | |
|
|
Crypto price predictions: Sui, Jasmy, Avalanche (AVAX)
Sui Blockchain made headlines by partnering with RedBull Racing. Jasmy has formed a rising wedge pattern on the hourly chart. AVAX has formed a double-bottom pattern. Cryptocurrency prices remained in a consolidation mode this week even after the US Congress voted for a bipartisan bill to avert a government default. дальше »
2023-6-3 16:05 | |
|
|
Daily CEX crypto trade volume sinks to lows last seen in 2020
Daily trade volume from centralized exchanges (CEX) has sunk to lows last seen in late 2020, per data from Kaiko. Crypto sentiment The chart below shows a pattern of declining CEX trade volume tops from May 2021 onwards. дальше »
2023-6-2 17:47 | |
|
|

Dogecoin Chart Pattern Suggests Volatility Explosion Ahead
A technical analysis indicator called Bollinger bandwidth suggests dogecoin's unusual calm could soon end with a pronounced move in either direction. дальше »
2023-5-30 15:20 | |
|
|
Gala Price Analysis & Prediction (May 26th) – GALA Forms Bullish Pattern, Looking Poise For Increase
The gaming cryptocurrency – Gala surged by roughly 2% today following a slight bounce yesterday. The monthly bullishness seems to be suspended as it now forms a bullish pattern on the daily chart. Unlike larger-cap coins that rolled back to the bottom last two weeks, GALA looks a bit far from there but it has […] дальше »
2023-5-26 10:06 | |
|
|
Bitcoin Bearish Chart Pattern Looms, Legendary Trader Sounds Warning
Bitcoin, the largest cryptocurrency by market capitalization, has shown significant weakness in today’s trading session after failing to continue on its instant price rally following yesterday’s release of the April CPI report at 4. дальше »
2023-5-11 20:30 | |
|
|
Should Investors Be Concerned About Bitcoin’s (BTC) Chart Pattern?
The Bitcoin (BTC) price could catalyze a sharp fall if it breaks down from this pattern. The post Should Investors Be Concerned About Bitcoin’s (BTC) Chart Pattern? appeared first on BeInCrypto. дальше »
2023-5-8 15:00 | |
|
|