2021-2-27 18:54 |
The majority of the cryptocurrency market has decreased considerably since Feb. 21, with some coins being hit much harder than others.
In this article, we’ll look at the eight coins that have decreased the most over the past seven days (Feb 19 – 26).
They are:
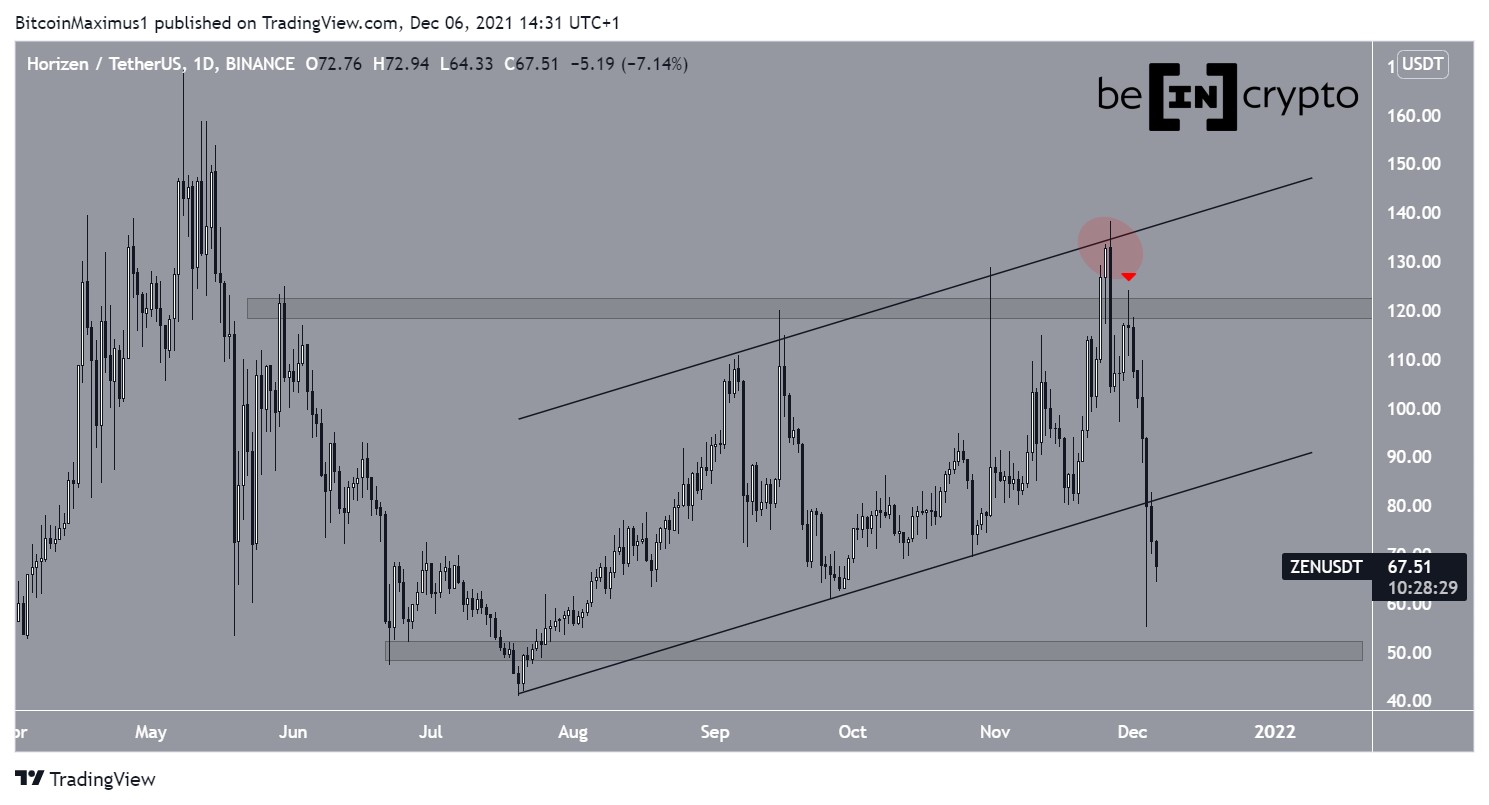
Horizen (ZEN) – 40.69% Venus (XVS) – 36.54% Icon (ICX) – 35.84% Zcash (ZEC) – 35.57% Dash (DASH) – 34.74% Pancake Swap (CAKE) – 32.95% Avalanche (AVAX) – 32.73% Bitcoin Cash (BCH) – 32.64% Horizen (ZEN)After a period of consistent rallying that has been going on since Nov. 20, ZEN finally reached an all-time high price of $86 on Feb. 18 and has been moving downwards since.
So far, ZEN has fallen by 45%, currently trading near $46. ZEN initially bounced at the 0.5 Fib retracement support level at $47.1, but has fallen back below since.
Technical indicators are bearish, and it has broken the parabolic ascending support line it had been following throughout the increase. Therefore, it’s possible that the upward trend has ended and ZEN has now begun a correction.
If so, while a short-term bounce could occur as a result of the significant drop, ZEN will likely continue decreasing at least until the 0.618 Fib retracement level at $38.
ZEN Chart By TradingView Venus (XVS)XVS has been decreasing since reaching an all-time high price of $102.94 on Feb. 19.
The high was made right at the 1.61 Fib extension of waves 1-3, so the entire bullish impulse (orange) that began on Jan. 21 may have ended.
This is supported by the bearish cross in the Stochastic oscillator, even though both the RSI and the MACD are still bullish. Nevertheless, XVS has bounced at the $47 support area, creating two long lower wicks.
Therefore, a bounce towards the $72 area is likely, but it needs to reclaim it to turn the trend bullish.
XVS Chart By TradingView Icon (ICX)ICX has been decreasing since reaching a high of $2.69 on Feb. 19. The decrease left a long upper wick in its wake, while ICX failed to close above the long-term $2 resistance area.
Despite the drop, technical indicators are still bullish.
Furthermore, ICX is trading between the 0.5-0.618 Fib retracement levels of the most recent upward move, so it may find support near the current price area.
The most likely scenario would have ICX creating some sort of structure before eventually breaking out above the $2 resistance area.
ICX Chart By TradingView Zcash (ZEC)ZEC has been falling since it reached a high of $203 on Feb. 19. Despite the nearly 50% drop to $120, where it is currently trading, ZEC has validated the previous breakout level at $110.
Technical indicators are still bullish, and as long as ZEC does not close below this level, the trend is still bullish.
If ZEC bounces, the next closest resistance area would be at $345 , the 0.382 Fib retracement level when measuring from the all-time high price.
ZEC Chart By TradingView Dash (DASH)DASH has been decreasing since it reached a high of $335 on Feb. 19. The drop has taken DASH to the $210 area, which had previously been acting as resistance.
Despite the re-test, DASH has yet to bounce, currently trading around $215. The weekly close is extremely important, since DASH could either create a bearish engulfing candlestick or a long lower wick.
Technical indicators are still bullish, as evidenced by the bullish cross in the Stochastic oscillator and the increasing MACD.
If DASH bounces and validated the $210 area as support, the next resistance area would be $500.
DASH Chart By TradingView PancakeSwap (CAKE)The CAKE move has been parabolic since the beginning of Jan. 2020. On Feb. 19, CAKE reached an all-time high price of $21.45 and has been moving downwards since.
The decline caused CAKE to break down from its parabolic ascending support line and the Stochastic oscillator to form a bearish cross.
While CAKE has initiated a small bounce at the 0.5 Fib retracement level at $11.12, it’s more likely to decrease to the 0.618 Fib at $8.68, where there is also horizontal support.
Despite the drop, CAKE was listed on both Kucoin and VCC exchanges last week (Feb 15 – 19).
CAKE Chart By TradingView Avalanche (AVAX)The AVAX increase has been parabolic almost since its inception. However, the price has been decreasing since it reached an all-time price of $60.30 on Feb. 10.
Technical indicators are decisively bearish, as evidenced by the bearish cross in the Stochastic oscillator, RSI cross below 50, and the negative MACD.
Despite the possibility that the trend has turned bearish, AVAX is trading between the 0.5-0.618 Fib retracement support levels, so some type of bounce is likely, even if AVAX were to head lower eventually.
Furthermore, AVAX is approaching a long-term ascending support line, which coincides with the 0.618 Fib retracement level.
On Feb. 25, AVAX also announced a partnership with CTSI, a move that could positively affect its price.
AVAX Chart By TradingView Bitcoin Cash (BCH)BCH has been decreasing since reaching a high of $775 on Feb. 15. The drop has taken BCH all the way to the $470 area, from which it previously broke out.
Due to a previous deviation below, the support area and its reclaim are not as clean as those in DASH and ZEC. It’s still likely that this is a possible re-test. Furthermore, both the MACD and Stochastic oscillator are bullish.
While the weekly RSI previously generated bearish divergence (blue), a drop already occurred as a result, and the RSI is in the process of potentially generating hidden bullish divergence (green).
BCH Chart By TradingViewFor BeInCrypto’s latest Bitcoin (BTC) analysis, click here.
The post The Hateful Eight: ZEN, XVS, ICX, ZEC, DASH, CAKE, AVAX, and BCH – Biggest Losers Over the Past 7 Days appeared first on BeInCrypto.
origin »Bitcoin price in Telegram @btc_price_every_hour
ICON (ICX) на Currencies.ru
|
|