Tezos’ Downtrend Might Soon Be Coming to an End

Tezos’ Downtrend Might Soon Be Coming to an End
фото показано с : beincrypto.com

2020-5-11 19:10

The Tezos (XTZ) price has been decreasing since April 16, when it reached a high of 37,930 satoshis. The price has finally reached an important support level that could initiate a trend reversal.

The aforementioned losses were paused on May 8, and the price has been gradually increasing since.

Several important support levels were outlined by well-known trader @inmortalcrypto, in an XTZ chart that shows support levels slightly below the current price. These supports are made up of an ascending line and the 100-day moving average (MA).

Source: Twitter

Inmortal has outlined a buy zone slightly below 30,000 satoshis, a level that could initiate a bounce for Tezos.
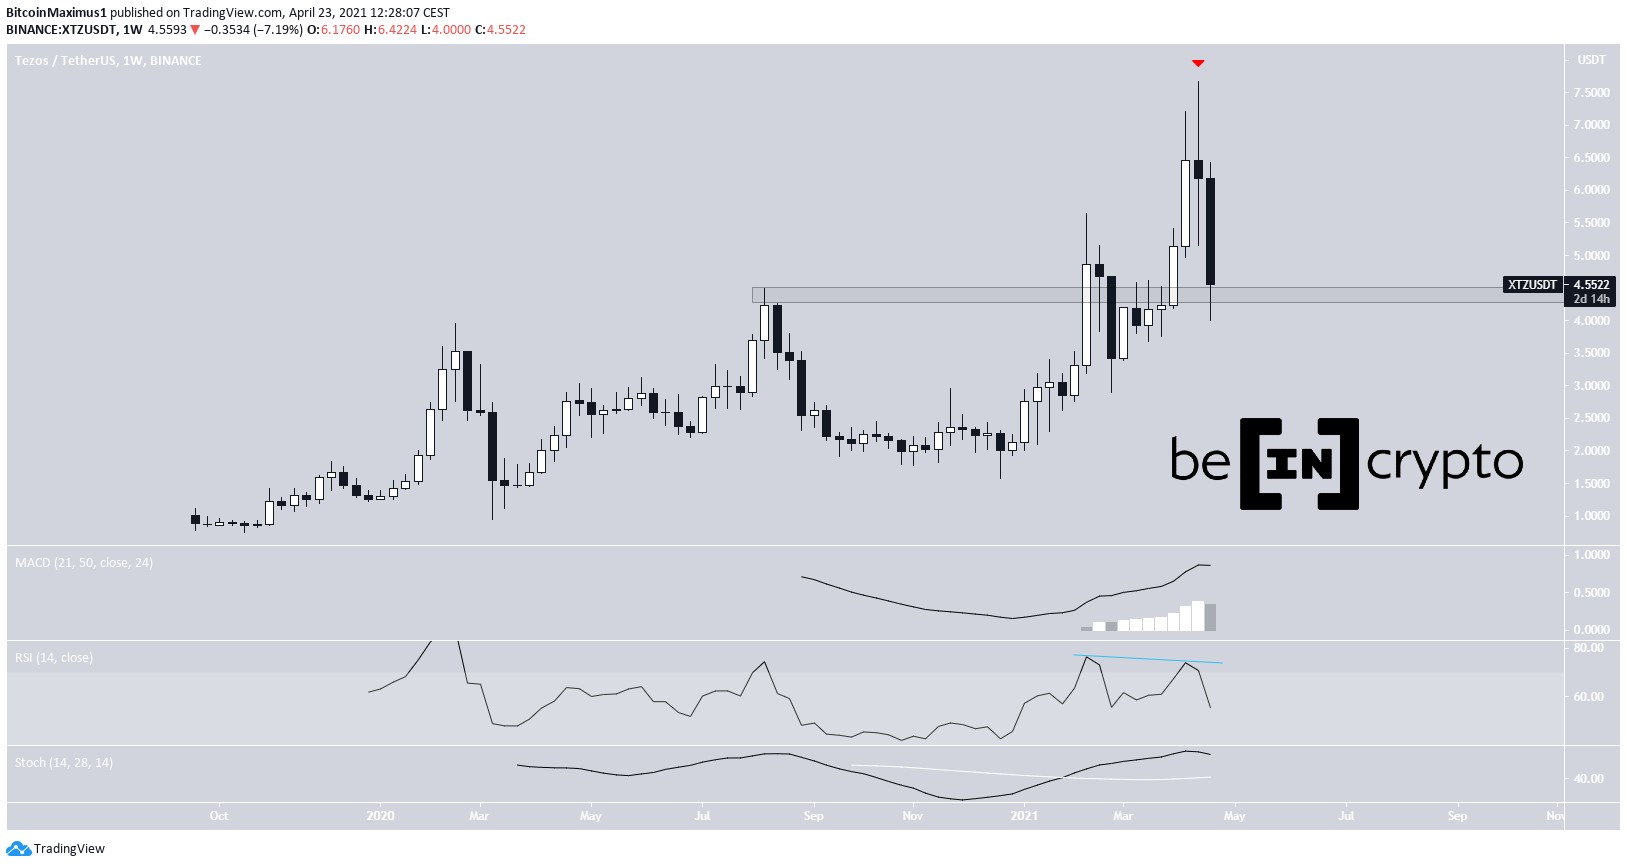
XTZ Ascending Support

The XTZ price has been following an ascending support line since Jan 13 and has currently validated it for the fourth time. While the price is still holding on above this support line, the price action does not seem entirely bullish.

XTZ has lost the support of the 100-day MA and has created a long upper-wick after making an attempt at moving above it.

A very strong support level is found at 25,000 satoshis, also strengthened by the presence of the 200-day MA. However, the price would have to break down from the current ascending support line in order to reach it.

In order to determine if that is likely, we will take a look at lower time-frames.

Tezos Chart By Trading View Double-Bottom

When looking at the movement since April 6, we can see that XTZ has possibly completed a five-wave Elliott formation along with an A-B-C correction that ended right at the 0.786 Fibonacci level of its last rally. If this is correct, the XTZ price will soon begin an upward move towards the closest resistance area, which is found at 33,000 satoshis.

The possibility of this move transpiring would increase if the price were to create a double bottom at the current horizontal support level, which is looking very likely. If that were to occur, the RSI would likely generate some bullish divergence, a sign that usually indicates when a price is reversing its trend.

XTZ/Dollar

In the XTZ/USD pair, the price has also decreased all the way to an ascending support line that has been in place since March 13.

This increases the possibility that the moves discussed in the previous section will transpire since an increase in XTZ/USD could also mean that the XTZ/BTC pair will move upwards.

Conclusion

The XTZ price has been decreasing for almost a month and has reached a long-term ascending support line. As long as the price is trading above this line, its price movement is considered bullish. In the short-term, the creation of a double-bottom could lead to an upward move towards 33,000 satoshis.

The post Tezos’ Downtrend Might Soon Be Coming to an End appeared first on BeInCrypto.

Similar to Notcoin - TapSwap on Solana Airdrops In 2024

origin »

Tezos (XTZ) на Currencies.ru

$ 0 (+0.00%)
Объем 24H $0
Изменеия 24h: 0.00 %, 7d: 0.00 %
Cегодня L: $0 - H: $1.0795
Капитализация $0 Rank 99999
Цена в час новости $ 2.4695 (-100%)

reached price tezos 930 satoshis reversal high

reached price → Результатов: 126


Фото:

How Long Will Digibyte Continue to Pump?

On March 23, the Digibyte (DGB) price reached a low of 52 satoshis. It immediately began an upward move which is still ongoing. To date, the price has increased by 462% since. Using the weekly chart, we can see that the upward move was preceded by a very significant bullish divergence in the RSI, which […] The post How Long Will Digibyte Continue to Pump? appeared first on BeInCrypto.

2020-5-7 17:10


Фото:

Outlining a Bullish Wave Count for Bitcoin

The Bitcoin price has reached a descending resistance line that has been in place for more than two years. A breakout above this line would have major bullish implications for the future price. Well-known trader @crypto_rand outlined a BTC chart that shows a possible bullish pennant, which he believes could cause a breakout, giving a […] The post Outlining a Bullish Wave Count for Bitcoin appeared first on BeInCrypto.

2020-5-6 23:20


Фото:

Bitcoin‘s Fate May be Determined By How it Responds to this Single Level

Bitcoin pushed higher overnight as bulls attempted to firmly surmount the $9,000 region, although the crypto faced yet another rejection at these price levels One fund manager is now noting that BTC’s current price region seems like a logical place for its uptrend to stall This comes as a respected trader notes that the crypto has reached a pivotal price level that could determine its fate in the weeks and even months to come Bitcoin […]

2020-5-1 21:00


Фото:

Bitcoin’s Breakout: New Upward Move or Retracement?

On April 29, the Bitcoin (BTC) price broke out from a short-term ascending channel that had been in place for the past five days. The price reached a high of $7966 before decreasing slightly. Bitcoin’s Breakout After five unsuccessful attempts at moving above the resistance line, the Bitcoin price finally managed to move above it […] The post Bitcoin’s Breakout: New Upward Move or Retracement? appeared first on BeInCrypto.

2020-4-29 14:58


Фото:

Crypto Price Analysis April 20: BTC, ETH, XRP, BCH, BSV, LTC, BNB, EOS, XTZ, LINK

The Bitcoin price has been decreasing since April 19, when it reached a high of $7,293. The next day, a sharp drop followed in which BTC lost almost $200 in only two hours. Ahead of the third halving, which is projected to occur on May 12, institutional investors have been showing increased interest in cryptocurrencies, […] The post Crypto Price Analysis April 20: BTC, ETH, XRP, BCH, BSV, LTC, BNB, EOS, XTZ, LINK appeared first on BeInCrypto.

2020-4-21 01:15


Фото:

What Does Bitcoin’s Bullish Weekly Close Indicate for the Future?

During the week of April 13-20, the Bitcoin (BTC) price reached a weekly close of $7120. This was the highest weekly close since the rapid decrease on March 12. Weekly Outlook In the weekly time-frame, the Bitcoin price has finally reached a close above the $6900 area — something it had been unsuccessfully trying to […] The post What Does Bitcoin’s Bullish Weekly Close Indicate for the Future? appeared first on BeInCrypto.

2020-4-20 11:58


Фото:

Crypto Price Analysis April 16: BTC, ETH, XRP, BCH, BSV, LTC, BNB, EOS, XTZ, LINK

In the early hours of April 16, the BTC price reached a low of $6,461. However, it immediately reversed its trend and has reached a high of $7,147 within the same day. This increase could have been caused by the printing of $120 million Tether (USDT), which occurred slightly prior to the price beginning its […] The post Crypto Price Analysis April 16: BTC, ETH, XRP, BCH, BSV, LTC, BNB, EOS, XTZ, LINK appeared first on BeInCrypto.

2020-4-17 19:15


Фото:

How Bitcoin’s Current Upward Move Compares to Previous Bull Traps

The Bitcoin price has been increasing rapidly since reaching a low on March 13. At the time of writing, BTC is trading a full 94% above the aforementioned low of $3,760. Despite the massive increase, not everyone is convinced that BTC has already reached a bottom, One such individual is cryptocurrency trader @CryptoCapo_, who outlined […] The post How Bitcoin’s Current Upward Move Compares to Previous Bull Traps appeared first on BeInCrypto.

2020-4-10 18:11


Фото:

Bitcoin’s Price Action Resembles a Bearish Wyckoff Distribution

On March 20, the BTC price reached a high of $6,900. Since then, it has been mostly trading in a range between $6,100-$6,900, with the exception of a failed breakdown attempt on March 27. On April 2, the price initiated a rapid upward move and reached a high of $7,192, however, the higher prices could […] The post Bitcoin’s Price Action Resembles a Bearish Wyckoff Distribution appeared first on BeInCrypto.

2020-4-3 17:10


Фото:

Is Bitcoin Moving in an Ascending Triangle or Wedge?

On April 2, the Bitcoin price initiated a very swift upward move, rallying from a low of $6,551 to a high of $7,194. While initially, it seemed that this movement would cause a breakout above the current pattern, the higher prices could not be sustained and BTC reached a close of $6,794, slightly below the […] The post Is Bitcoin Moving in an Ascending Triangle or Wedge? appeared first on BeInCrypto.

2020-4-3 13:45