2020-4-4 03:07 |
On March 13, the Bitcoin price reached a low of $3782. This was followed by a rapid upward move that eventually took the price to a high of $7199. This movement shares numerous similarities with the movement near December 2018, when the price reached a bottom of $3194.
This comparison was made by cryptocurrency trader @BruhItsKoda, who tweeted a chart comparing the Bitcoin movement in two time periods — one from January-March 2019 and the other from March 27 to today. After the January-March 2019 period, the price went on a very strong upward trend that took it from around $4000 to a high of $13,764 in June 2019.
It was really just a passing observation of similarity space-wide, not just price.. post "capitulation", people still calling for new lows, grinding up, big pop/fail above local high, everyone now bearish. Somewhat similar structure. I havent traded btc in weeks for the record. pic.twitter.com/Xxt8d0kK9y
— Bodanomics (@BruhItsKoda) April 2, 2020
Will the Bitcoin price act in a similar manner this time around? Continue reading below if you are interested in finding out.
Bitcoin Fractal ComparisonBoth movements are shown side by side in the image below. While there are many similarities, the time periods are different — more specifically, the 2019 movement is presented in the 12-hour time-frame while the current one in the two-hour one.
In both movements, the Bitcoin price generated three lower lows prior to beginning an A-B-C upward move. If the fractal continues to hold, the current price action is the first decrease after the C wave, after which the price will consolidate before initiating a rapid breakout.
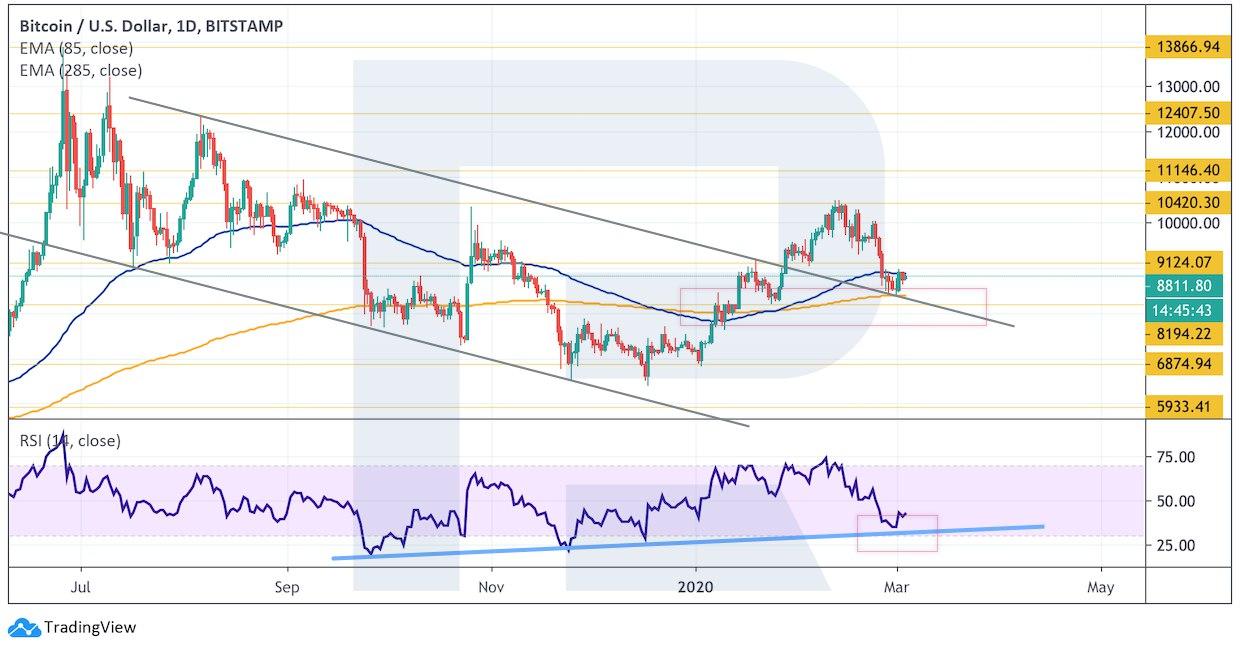
Bitcoin Chart By Trading ViewIn the current movement, the breakout would transpire on April 7. This fractal would perfectly fit with the possible ascending triangle that the price has been trading in since March 13.
While the price is currently trading above the resistance line, it has failed to reach a daily close above it. On the contrary, yesterday it generated a shooting star candlestick, albeit with a bullish close and proceeded to decrease.
The triangle is projected to end on April 7, fitting with the price action laid out by the fractal. A possible movement would be a decrease to validate the support lien of the triangle once more before the price breaks out.
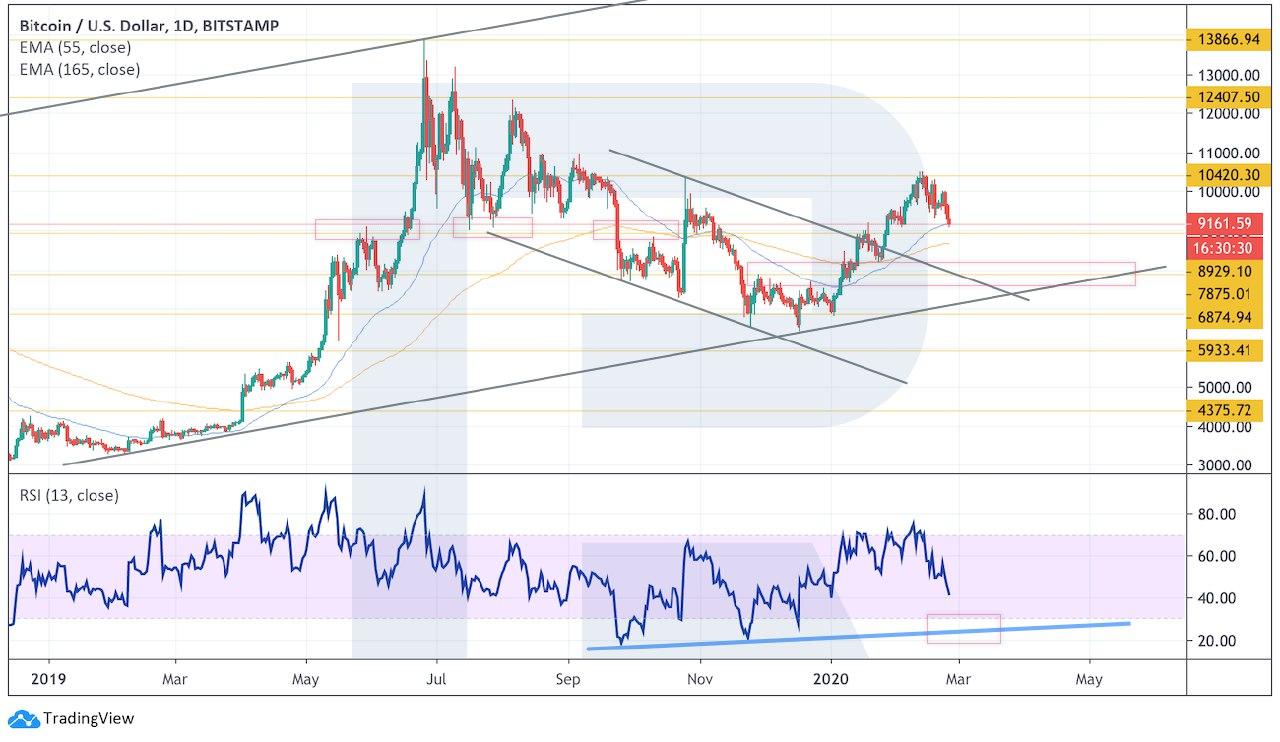
Bitcoin Chart By Trading View Other PossibilityHowever, this fractal is not yet confirmed. Staying with the same 2019 movement, it is possible that the price is following that fractal but has been doing so at a different time-frame.
In this case, the March 16 bottom coincides with that on December 6, 2018. Afterward, the price created what resembles a triple top, prior to decreasing considerably. If this fractal is followed, the price will consolidate between $5000-$7000 until the end of May prior to breaking out.
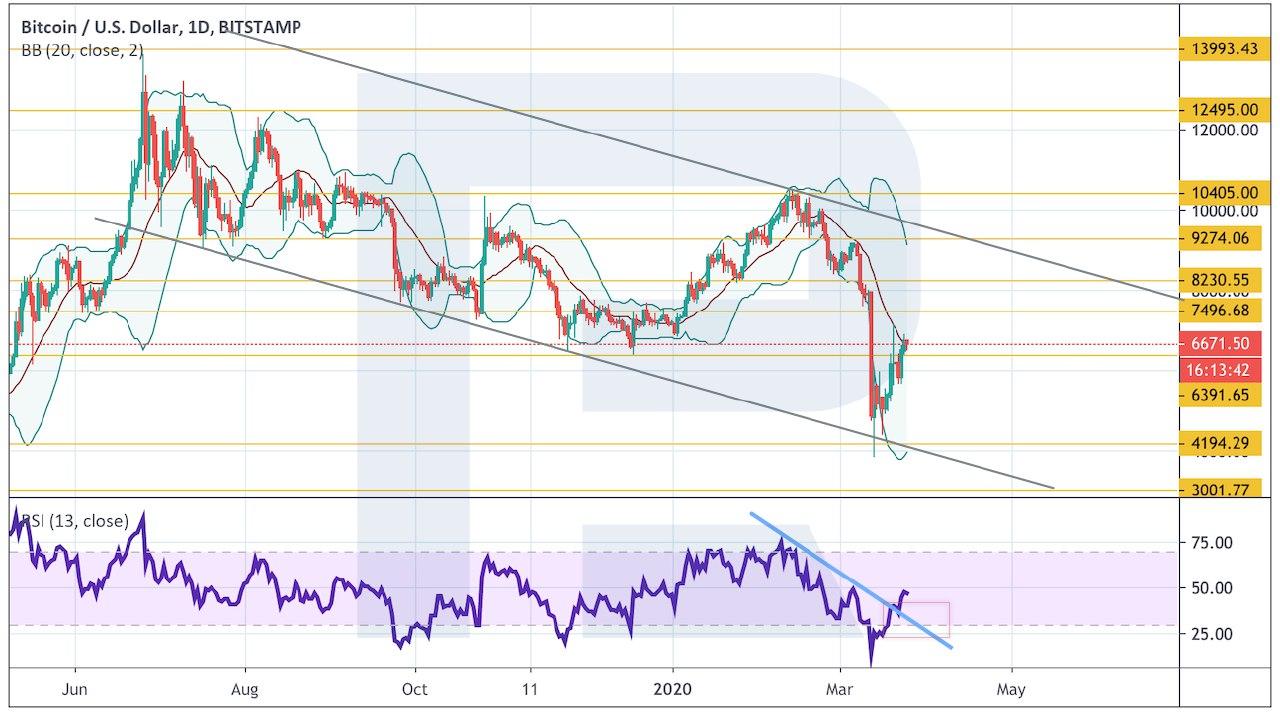
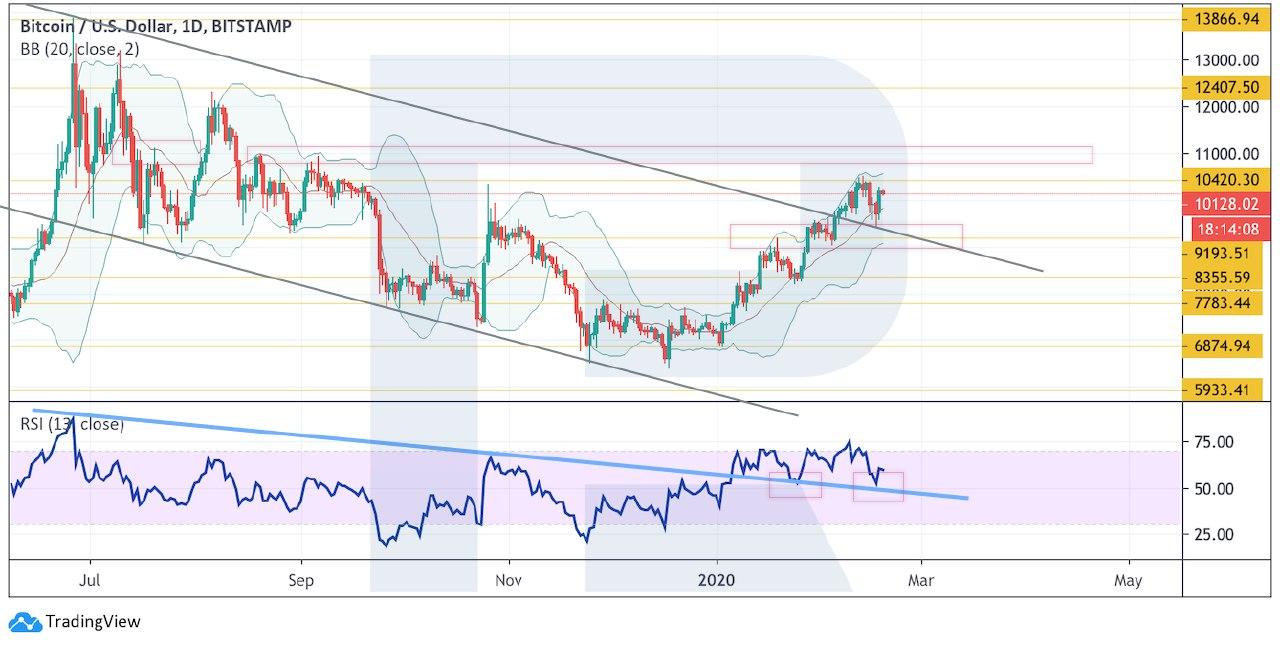
Bitcoin Chart By Trading ViewThis fractal fits better with the longer-term chart, which shows that the price is currently trading right at the weekly resistance level at $6900. The support level in the weekly chart is found at $5200. Therefore, if the fractal is followed, the price will decrease and validate it as support prior to breaking out.
Bitcoin Chart By Trading ViewTo conclude, the Bitcoin price is possibly following a fractal from the December 2018 bottom. The fractal suggests that the BTC price will consolidate for a while below $7000 before eventually breaking out. One possibility predicts an April 7 breakout while the other one in late May. The price action until the end of the week will go a long way in determining which one will transpire. If the price decreases below the current ascending support line at $6500, the latter is more likely, while if not, we are expecting a breakout on April 7.
The post Analyzing Bitcoin’s 2018 Bottom to Predict the Current Movement appeared first on BeInCrypto.
origin »Bitcoin price in Telegram @btc_price_every_hour
Bitcoin (BTC) на Currencies.ru
|
|