2020-4-21 01:15 |
The Bitcoin price has been decreasing since April 19, when it reached a high of $7,293. The next day, a sharp drop followed in which BTC lost almost $200 in only two hours.
Ahead of the third halving, which is projected to occur on May 12, institutional investors have been showing increased interest in cryptocurrencies, as is evidenced by numerous hedge funds entering the market.
The halving occurs in order to cut in half rewards for miners, which comes as a result of the fixed supply of BTC coins. This is in stark contrast with the USD, whose supply has been increasing massively and could continue doing so, considering a new stimulus bill has been proposed by U.S. representatives.
Without wasting too much time, let’s dive deep into an analysis of 10 cryptocurrencies and determine their future movement.
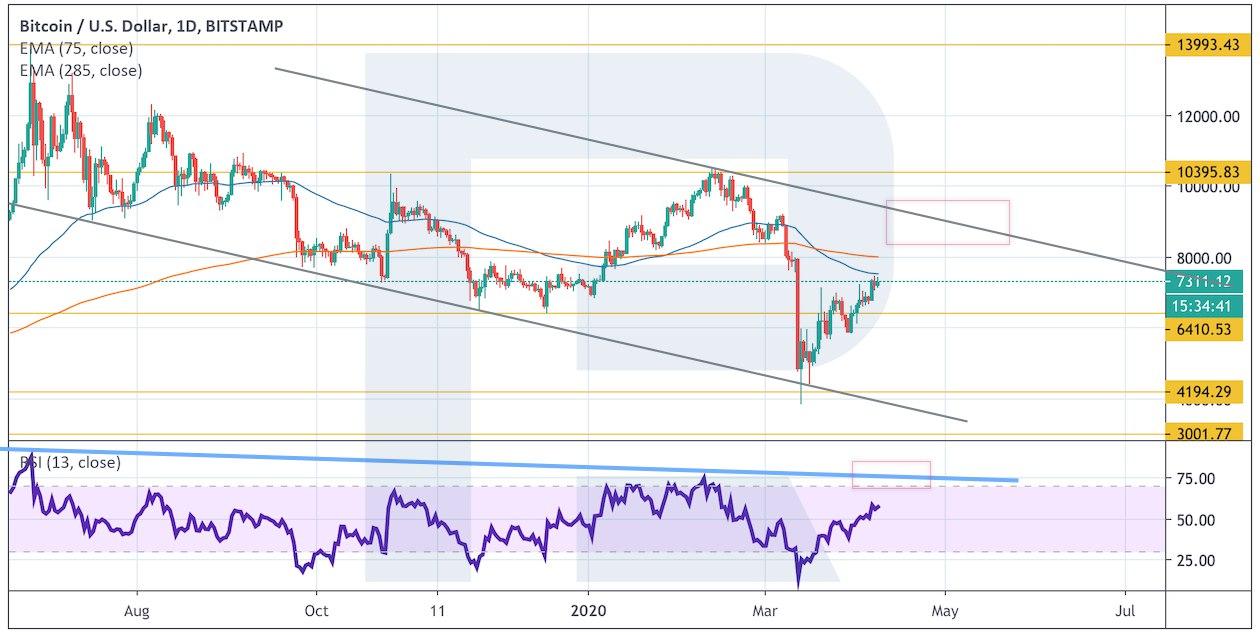
Bitcoin (BTC)The Bitcoin price is trading in a range between $6,650 and $7,200 and has been doing so since April 3. The movement inside the range has been characterized with two upward moves above the resistance of the range, which were both followed by rapid decreases back within the range.
The most recent such deviation occurred on March 18, and the price dropped inside the trading range the next day. At the time of writing, it was trading slightly above the midpoint of the range at $6,900.
Considering that the price has twice failed to break out above the resistance and has fallen back each time, the price is expected to decrease towards the range low at $6,650.
Bitcoin Chart By Trading View Ethereum (ETH)The Ethereum price has been gradually increasing since March 13, moving inside an ascending channel. At the time of writing, the price was trading very close to the resistance line of the channel, validating it for the fourth time.
After being rejected by the line, the price decreased until it reached the $175 area and validated it as support. As long as the price is trading above this area, it is expected to continue increasing at the rate predicted by the channel, possibly moving towards the resistance line.
However, the RSI has generated bearish divergence, which suggests that the price will decrease instead. The divergence is quite significant and present in both highs near the resistance line.
Therefore, we are expecting the price to eventually break down below the $175 support and validate the ascending support line of the channel once more.
Ethereum Chart By Trading View XRP (XRP)The XRP price is trading between support and resistance at $0.18 and $0.205, respectively. In the short-term, the price has broken out from a descending resistance line but has yet to validate it as support.
The most common movement from the current level would be a retest of the $0.18 support followed by an upward move towards the $0.205 resistance. The possibility of this movement transpiring is supported by the RSI, which has moved above 50 during the breakout, a bullish sign.
XRP Chart By Trading View Bitcoin Cash (BCH)The BCH price has just broken down from a head and shoulders pattern, which has a somewhat irregular shape. Afterward, the price returned to validate the breakdown level.
The ensuing movement is expected to be a continuation of the downward move towards the closest support area, which is found at $217. Interestingly, a downward move that travels the entire height of the pattern would take the price right at this support area, making it a very likely reversal level.
BCH Chart By Trading View Bitcoin SV (BSV)The BSV price had been following a descending support line since Jan. 14. The price broke out from this line on April 18 and validated it as support the next day.
There are three areas of interest for BSV: the support area at $150 and the resistance areas at $220 and $260, respectively.
Initially, the price is expected to move towards the first resistance area, found at $220. The reason for this is the breakout above the descending resistance line and the RSI movement above 50 as well as its subsequent validation as support.
Afterwards, the price is likely to decrease towards the $150 support, mostly due to the overall bearishness in the BTC price, which would likely cause a drop in the price of other coins. However, the possibility of the initial move going all the way to $260 is not ruled out, even if it is not the most probable outcome.
BSV Chart By Trading View Litecoin (LTC)The LTC price is trading inside a descending, broadening wedge. While it is not completely certain that the slope of both lines is correct, both have been validated at least three times.
At the time of writing, the price was resting at a very significant support level, found at $41. The level is also supported by the 200-period moving average (MA). As long as the price stays above it, then it is expected to continue moving upwards and eventually break out from the current pattern.
If it does so, the closest resistance level is found at $47.
LTC Chart By Trading View Binance Coin (BNB)The BNB price has been increasing since March 13, trading inside an ascending wedge. The price is quickly approaching the point of convergence between the support and resistance lines.
The outlook is bearish for several reasons:
First, the price has reached the resistance line which coincided with the $17 resistance area.
Second, the RSI has generated significant bearish divergence
Third, the ascending wedge is considered a bearish pattern.
Therefore, the price is expected to eventually break down from this wedge and move towards the closest support area at $13.5.
BNB Chart By Trading View EOS (EOS)The EOS price has been trading inside a symmetrical triangle since March 9. The resistance line has been validated thrice, most recently on April 18. The price is trading very close to the point of convergence between resistance and support, at which time a decisive move in one direction is expected.
Even though both options remain a possibility, it is more likely that the price will break down. This outlook is supported by the bearish divergence in the RSI and by the fact that the triangle is transpiring after a downward move, meaning it is likely to act as a continuation pattern.
If the price breaks down, the closest support level is found at $2.2. If to the contrary it breaks out, the closest resistance area is found at $3.1.
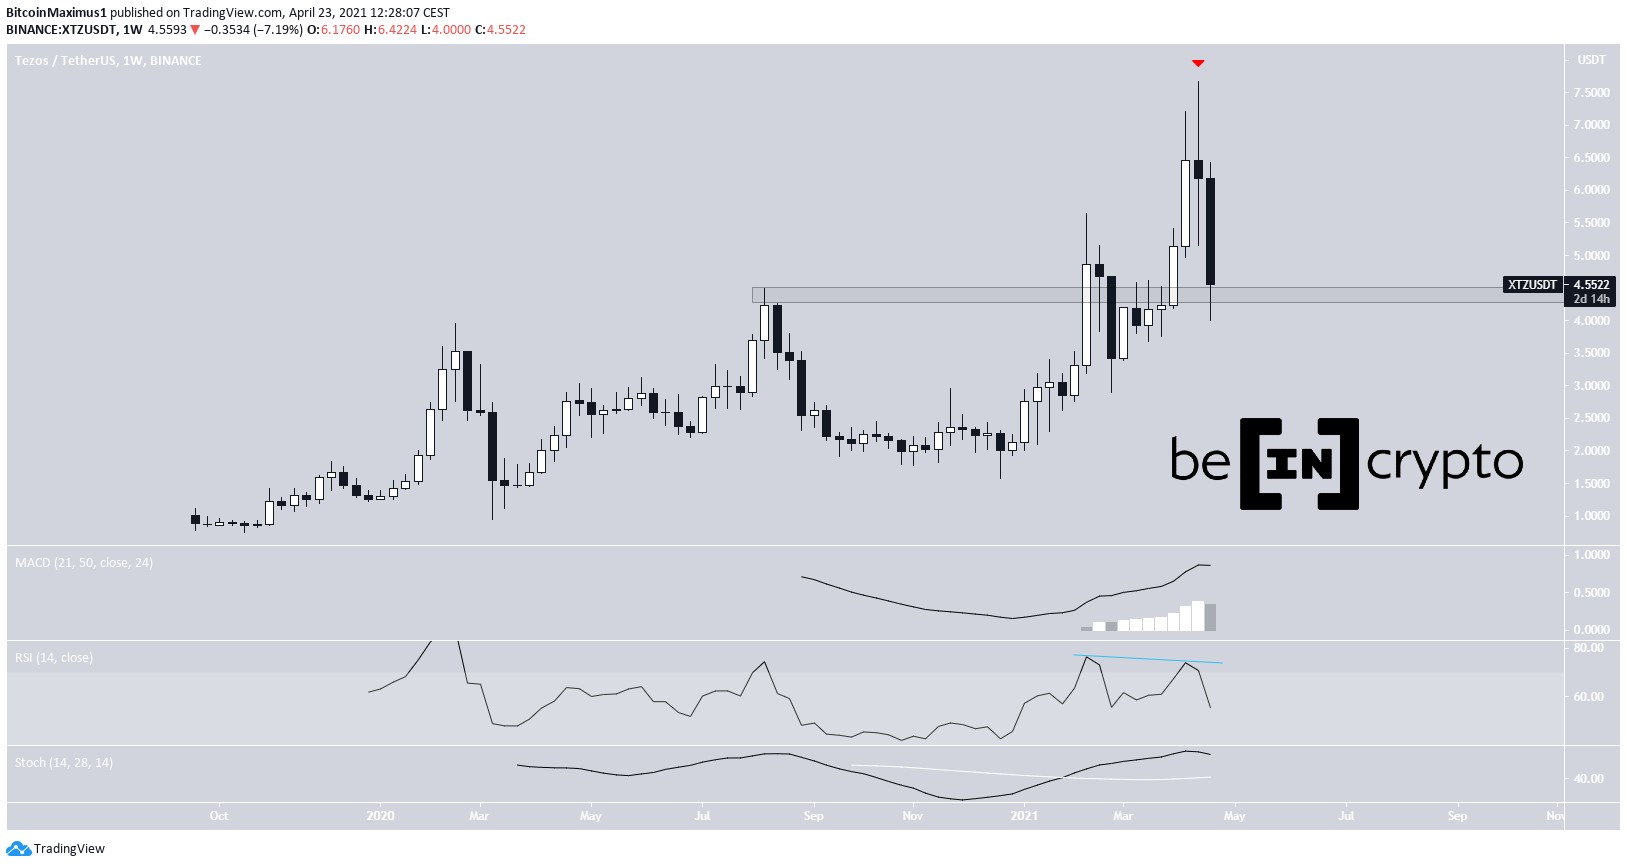
EOS Chart By Trading View Tezos (XTZ)The Tezos price has been gradually increasing inside an ascending channel since reaching a bottom on March 13. Both the resistance and support lines have been validated numerous times.
At the time of writing, the price was in the process of moving downwards after validating the resistance line of the channel on March 19. This movement was preceded by bearish divergence in the RSI, which albeit is not very pronounced.
However, the price has yet to reach the main resistance area at $2.6. A likely movement would be a retest of this area, which would coincide with the resistance line of the channel followed by a downward move towards the support line.
XTZ Chart By Trading View Chainlink (LINK)The LINK price has been increasing at the rate predicted by an ascending support line since March 13. The rate of increase accelerated on April 6, and the price has not validated the support line since.
On Aprl 18, the price reached the $3.8 resistance area and has decreased slightly since. However, the RSI has generated very considerable bearish divergence, a sign that the price is likely to move downwards.
LINK Chart By Trading ViewIf it does, it is likely to find support at $3, which is both a minor support area and coincides with the ascending support line.
The post Crypto Price Analysis April 20: BTC, ETH, XRP, BCH, BSV, LTC, BNB, EOS, XTZ, LINK appeared first on BeInCrypto.
origin »Bitcoin price in Telegram @btc_price_every_hour
Bitcoin (BTC) на Currencies.ru
|
|