2020-12-12 16:28 |
A crucial resistance level has rejected the ICON (ICX) price and it has fallen back to a long-term support line. ICX should break down from this line and drop towards the support levels outlined in the article.
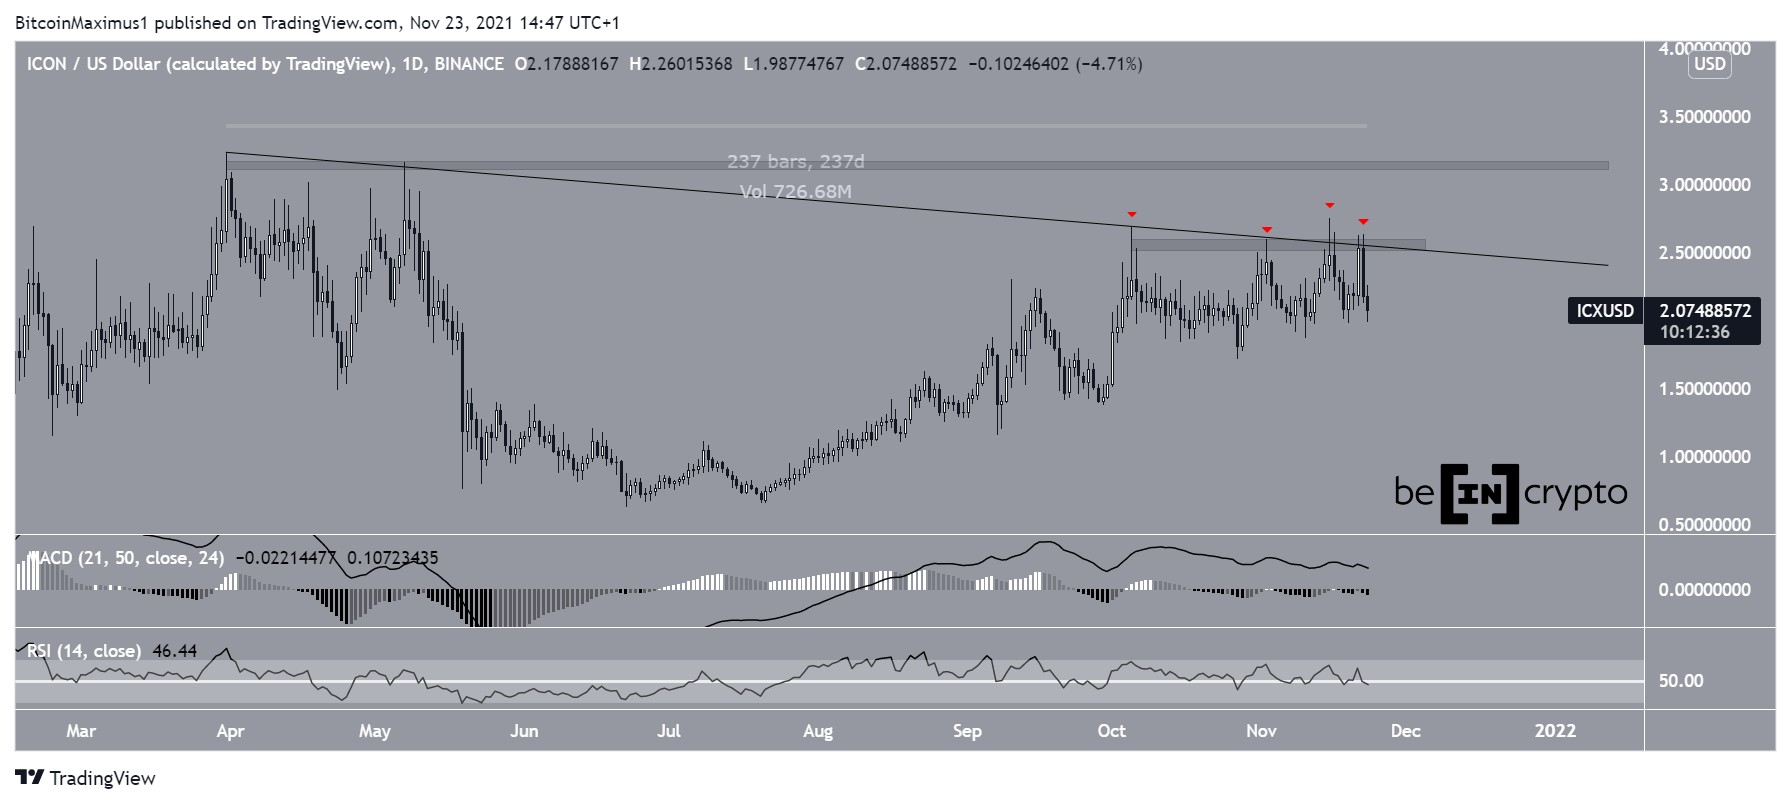
Long-Term LevelsThe ICX price has been following an ascending support line since Dec. 2019. While following this line, it made several attempts to break out above the $0.45 resistance area, which resulted in long upper wicks.
On Aug 14, ICX successfully broke out and reached a high of $0.80 on Aug 22. However, this also left a long upper wick, and it has declined below the $0.45 area again, returning to its ascending support line.
Technical indicators are bearish, suggesting that another drop is in store. Therefore, if ICX breaks down from this support line, it could be in for an extended correction.
Chart By TradingView ICX Breaks DownThe daily chart does nothing to dissuade from the long-term readings in which a breakdown is likely.
ICX has already broken down from a short-term ascending support line that had previously been in place since the beginning of November and validated it as resistance afterward. While doing so, it also validated the $0.385 area as resistance.
Indicators on the daily time-frame are also bearish and support the possibility of a continued downward move at least towards $0.33, the 0.85 Fib retracement level, and a minor support area. The low would also coincide with the long-term ascending support line outlined previously.
Chart By TradingView Wave CountThe wave count also suggests that another drop is in store. The movement leading up to the Nov. 25 high looks like an A-B-C corrective structure. If correct, ICX has now begun a bearish impulse (both shown in orange below).
The price seems to be in the third wave, which is the longest and has become extended (the sub-wave count is given in black).
If correct, the ICX price would fall at least to $0.27 and possibly lower. An increase above the wave 1 low at $0.37 would invalidate this particular wave count.
Chart By TradingView ICX/ BTCCryptocurrency trader @Thecryptomist outlined an ICX/BTC chart showing a descending wedge and bullish divergence in the RSI. This indicates that ICX is likely to break out.
Source: TwitterSince the tweet, ICX has broken down from the wedge instead. Currently, it is heading towards the support area at 1925 satoshis.
A breakdown from this level could initiate a very sharp drop, and due to the bearish readings from the ICX/USD pair, it seems the most likely scenario.
ICX Chart By TradingView ConclusionTo conclude, the ICX price is likely in a bearish impulse and should continue correcting at least to $0.27 and possibly lower. Similarly, the ICX/BTC pair is expected to drop towards support at 1925 satoshis and possibly lower.
For BeInCrypto’s latest ZIL analysis, click here!
Disclaimer: Cryptocurrency trading carries a high level of risk and may not be suitable for all investors. The views expressed in this article do not reflect those of BeInCrypto.
The post ICX Drops After Rejection From Long-Term Resistance appeared first on BeInCrypto.
origin »Bitcoin price in Telegram @btc_price_every_hour
Resistance (RES) на Currencies.ru
|
|