Новости о Horizontal Resistance [ Фото новости ] [ Свежие новости ] | |

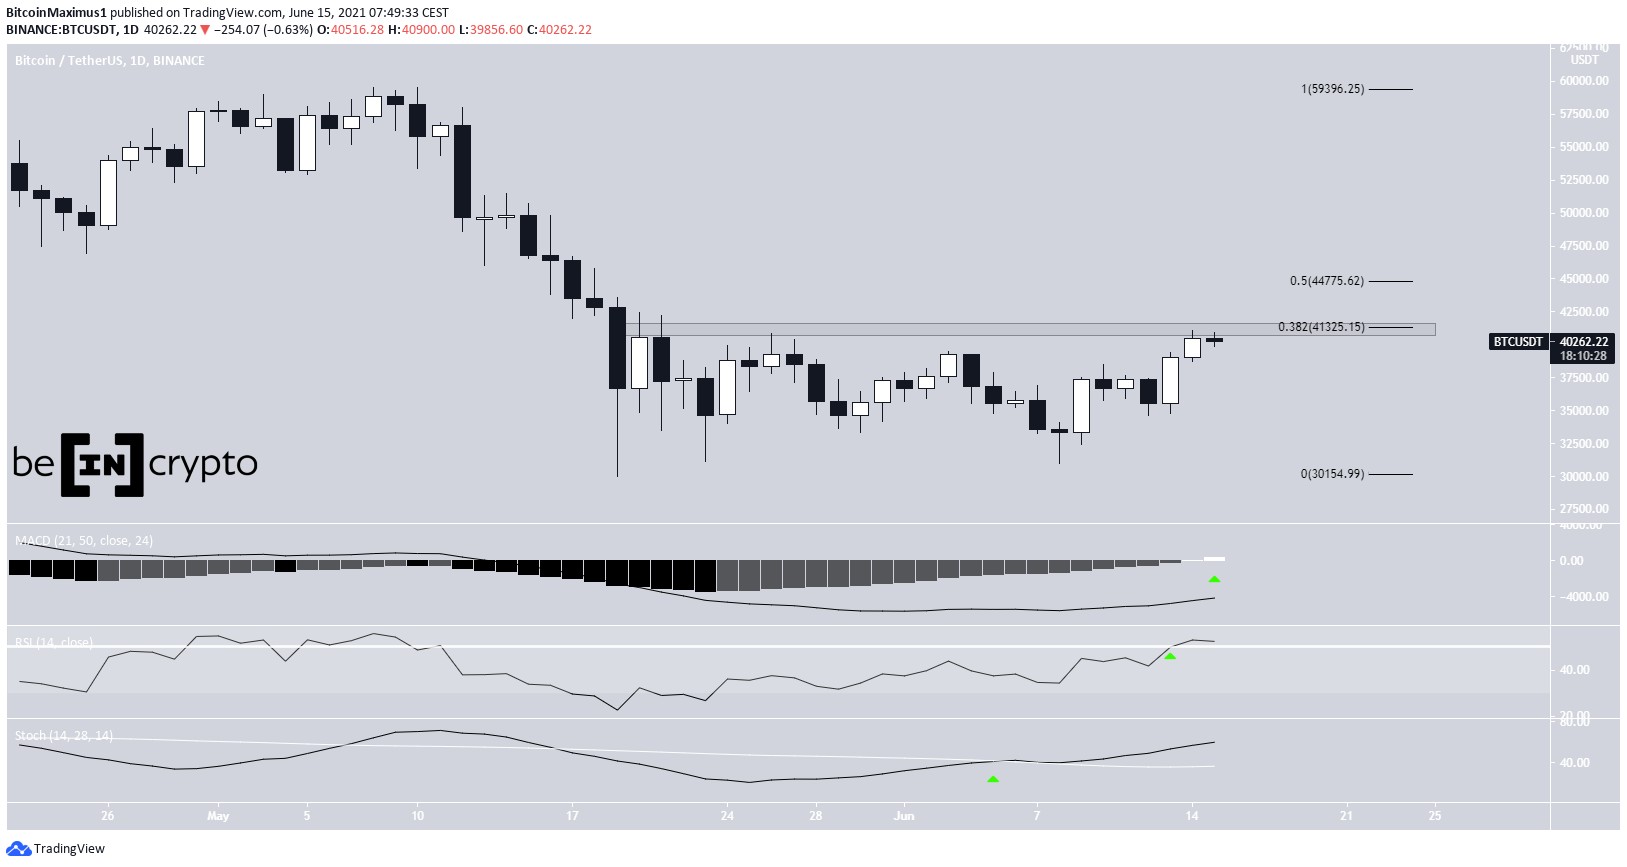
BTC, ETH, XRP, AAVE, ZEC, MATIC, LINK — Technical Analysis June 15
Bitcoin (BTC) has reached a horizontal and Fib resistance at $41,325 and is trading inside an ascending parallel channel. The post BTC, ETH, XRP, AAVE, ZEC, MATIC, LINK — Technical Analysis June 15 appeared first on BeInCrypto. дальше »
2021-6-15 13:37 | |
|
|
BTC, ETH, XRP, HOT, DASH, EOS, CRV — Technical Analysis April 15
XRP (XRP) might have reached a short-term top. Holo (HOT) has broken out from a descending resistance line. Dash (DASH), EOS (EOS), and Curve DAO Token (CRV) are in the process of breaking out from horizontal resistance levels. дальше »
2021-4-15 15:50 | |
|
|
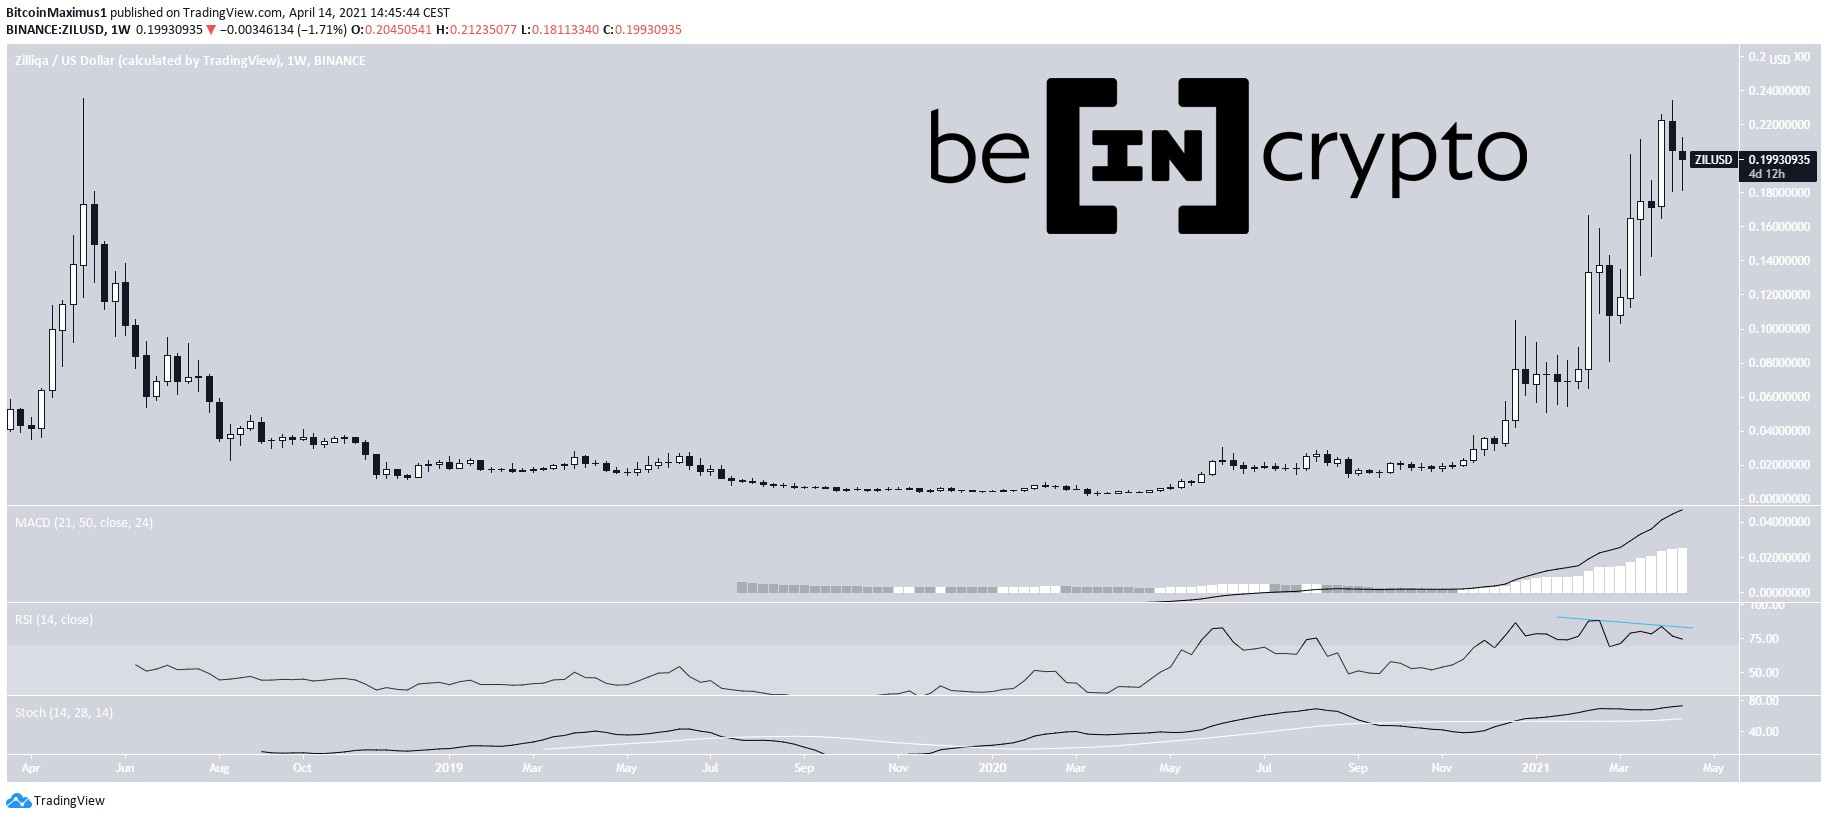
ZIL Shows Weakness, DGB and NANO Reclaim Key Levels
Digibyte (DGB) has broken out from a horizontal resistance level but is approaching a Fib resistance. Nano (NANO) has broken out from a descending resistance line. Zilliqa (ZIL) ZIL has been increasing rapidly since the beginning of the year. дальше »
2021-4-14 17:03 | |
|
|
BTC, ETH, XRP, DOGE, BSV, ONT, ALGO – Technical Analysis April 14
Dogecoin (DOGE) just reached a new all-time high price while XRP is aiming to increase above $2. Algorand (ALGO), Bitcoin SV (BSV), and Ontology (ONT) have moved above horizontal resistance levels. дальше »
2021-4-14 13:49 | |
|
|
DeFi Coins Rally With Release of New ETFs
In addition, the World Economic Forum (WEF) has had numerous discussions about the DeFi sector. Finally, HBTC launched six new ETFs, with Kava. io (KAVA) being one of them. Compound (COMP) has broken out from a descending resistance line, but was rejected by a horizontal resistance area. дальше »
2021-4-12 19:43 | |
|
|
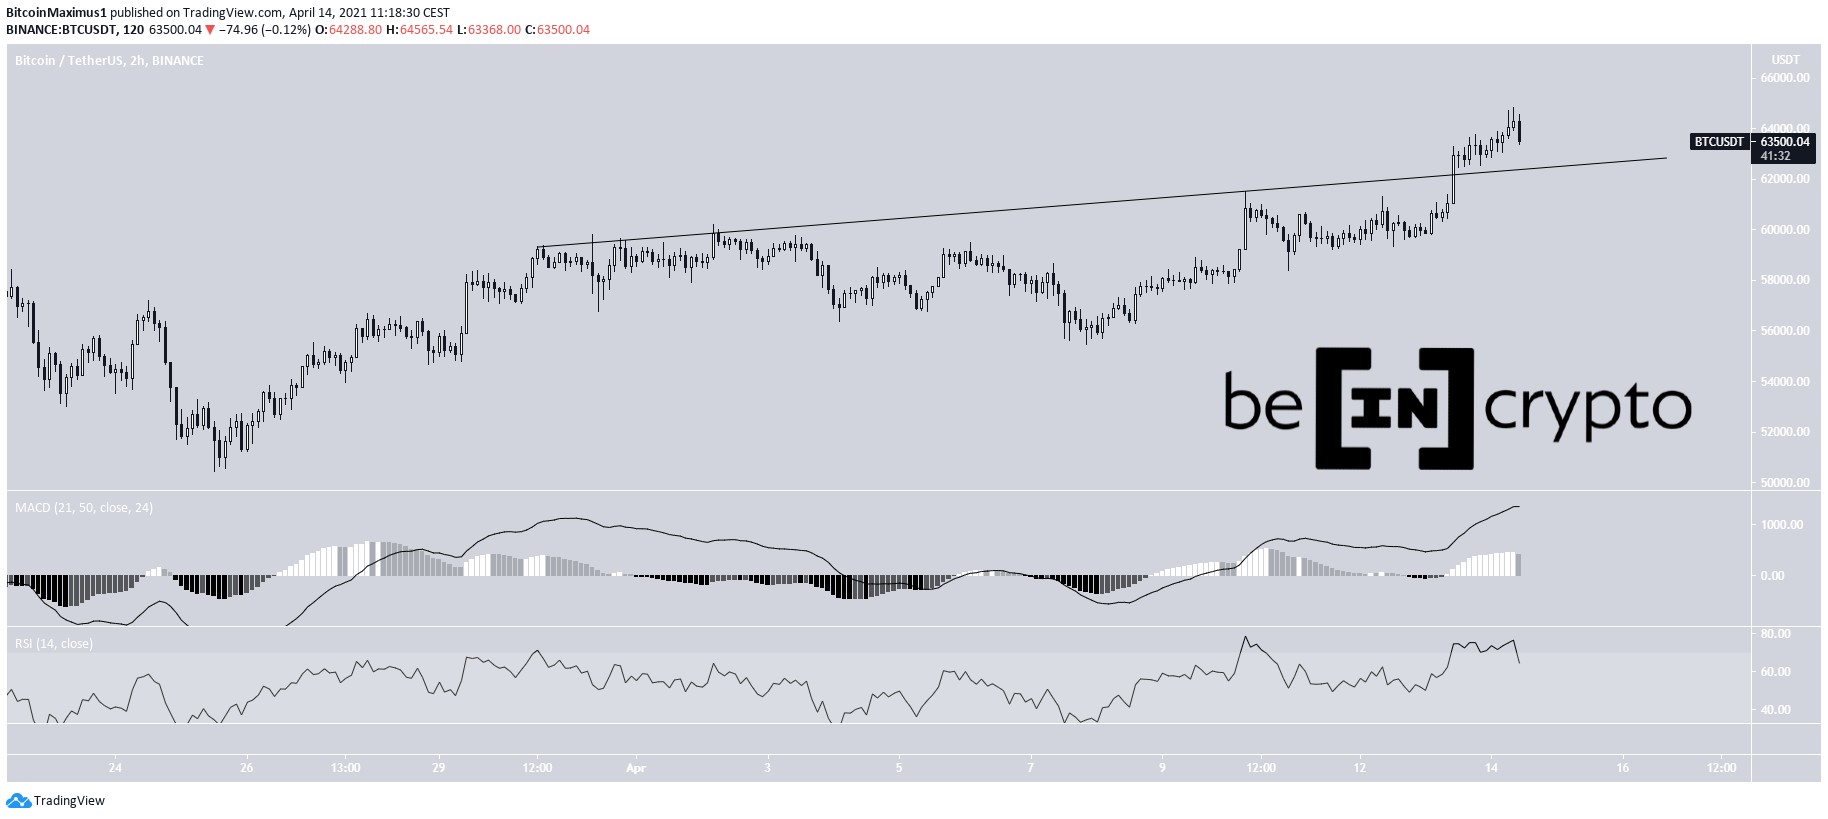
Bitcoin (BTC) Reaches Highest-Ever Weekly Close
BTC is expected to break out above the current horizontal resistance area and reach a new all-time high price. Highest-ever weekly close BTC increased slightly last week, going from a low of $55,473 to a high of $61,500. дальше »
2021-4-12 10:21 | |
|
|
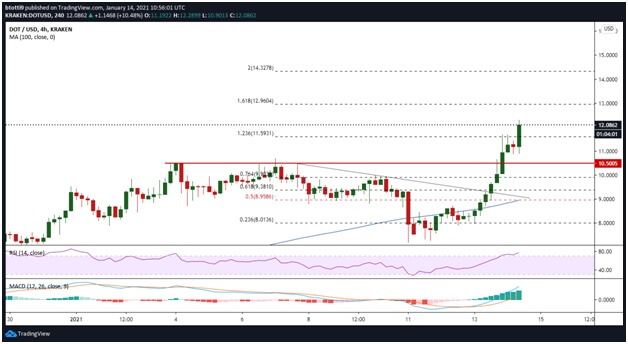
Polkadot, Tezos, Elrond Price Analysis: 22 March
Polkadot looked uncertain of rising above the $38.2 resistance on low volumes. Tezos moved within a horizontal channel and projected an upwards breakout, while Elrond negated a descending triangle aftThe post Polkadot, Tezos, Elrond Price Analysis: 22 March appeared first on AMBCrypto. дальше »
2021-3-23 22:00 | |
|
|
QTUM, LIT & REN: Technical Analysis For March 9
QTUM has broken out from a descending resistance line. Still, it is facing resistance at $5. 65. LIT has broken out from a descending resistance line. However, it was rejected by a horizontal resistance area afterwards. дальше »
2021-3-10 19:43 | |
|
|
BTC, ETH, XRP, EOS, TRX, DASH, LTC: Technical Analysis for March 2, 2021
XRP (XRP) is trading in a range between $0. 36 – $0. 63, currently being very close to the former. EOS (EOS) has broken out from a horizontal resistance area before returning to it, potentially validating it as support. дальше »
2021-3-2 11:24 | |
|
|
Tron, Ethereum Classic, IOST Price Analysis: 15 January
Tron faced resistance from a horizontal level, as well as from a Gann fan line, and was likely to see a rejection at the level of resistance. Ethereum Classic dipped towards $7.5, but can defend it anThe post Tron, Ethereum Classic, IOST Price Analysis: 15 January appeared first on AMBCrypto. дальше »
2021-1-15 15:00 | |
|
|
Tellor (TRB) Makes Fifth Attempt at Breaking Out Over Major Resitance Level
The Tellor (TRB) price is in the process of breaking out from a horizontal resistance level at $26. The price is expected to be successful in breaking out and eventually move towards the next closest resistance level. дальше »
2020-11-16 13:01 | |
|
|
ZIL’s Upward Move Has the Potential for Considerable Gains
The Zilliqa (ZIL) price has been increasing since Sept 21 and has reclaimed an important horizontal level while breaking out from a short-term descending resistance line. The price is likely to continue moving upwards towards the resistance levels outlined below. дальше »
2020-11-12 21:35 | |
|
|
Zcash (ZEC) Struggles to Break Out Above Horizontal Resistance Level
While the Zcash (ZEC) price has broken out from a short-term descending resistance line, it is more likely that the upward move is corrective. ZEC is currently trading slightly above its long-term $52. дальше »
2020-11-10 14:58 | |
|
|
BTCD Breaks Out But Has Yet to Clear Long-Term Resistance
The Bitcoin Dominance Rate (BTCD) has broken out from a bullish reversal pattern and reclaimed an important horizontal level. While BTCD is likely to increase towards the long-term descending resistance line outlined below, a breakout is required for the long-term trend to remain bullish. дальше »
2020-10-29 23:00 | |
|
|
BTCD Struggles With Resistance, Trend Remains Unclear
The Bitcoin Dominance Rate (BTCD) is struggling to move above an important horizontal level, the reaction to which is crucial in determining the future trend. Breakout From Resistance The Bitcoin dominance rate has been declining alongside a descending resistance since reaching a high of 64. дальше »
2020-10-17 19:45 | |
|
|
Total Cryptocurrency Market Cap Remains Bullish Despite Deep Cut
The Total Cryptocurrency Market Cap (CRYPTOCAP) has broken out and validated an important horizontal level as support. As long as it is trading above it, the trend remains bullish. Cryptocurrency Cap Re-Tests Resistance The CRYPTOCAP has increased by 186% since the March crash 186 days ago. дальше »
2020-9-11 09:17 | |
|
|

What Does Bitcoin’s Monthly Close Tell Us About Future Prices?
The Bitcoin (BTC) price reached a close of $9448 for the month of May, which was the highest close since August 2019. However, the price is still facing considerable diagonal resistance and horizontal resistances in the weekly time-frame. дальше »
2020-6-2 04:27 | |
|
|

REN Nears End of Bullish Trend While MATIC May Be Just Starting Its Own
MATIC has just broken out from an important resistance level and could increase rapidly due to the lack of resistance above the current price level. While REN has successfully flipped and important horizontal resistance level, its upside potential seems limited, due to the fact that it has yet to clear numerous important resistance areas. дальше »
2020-5-27 01:15 | |
|
|

This Crypto Could Soon Explode as it Peeks Over Massive Resistance
While the aggregated crypto market consolidates following the recent upswing, Tezos has continued climbing higher as it expresses further signs of strength against many of its peers. This strength has now led the crypto to push above a key horizontal resistance region that was significantly hampering its price action in the past, with a confirmed break above this level potentially opening the gates for significant upside in the days and weeks ahead. The move past […] дальше »
2020-4-19 23:00 | |
|
|
Ethereum (ETH) Price Analysis (February 25)
• Price now trades in a range near resistance level. • The crypto is in a strong up move. ETH/USD Medium-term Trend: Bullish • Resistance levels : $290, $300, $310 • Support levels: $110, $100, $80 Ethereum is forming an ascending triangle and looks bullish in its medium-term. дальше »
2020-2-25 07:38 | |
|
|
Global Altcoin Breakout Could Usher Return of Alt Season Crypto Riches
The altcoin market has been ablaze all 2020 thus far, after the total crypto market and many individual altcoins broke out from downtrend resistance and went on massive rallies. Next, altcoins are preparing a global breakout of major, horizontal resistance, which if holds could lead to a return of alt season and richest beyond investor’s... The post appeared first on NewsBTC. дальше »
2020-2-4 20:00 | |
|
|

The Waves Price Fails to Break out Above Decisive Resistance
The Waves price has been decreasing since December 30 and has reached a significant support area. Cryptocurrency trader and analyst @PostyXBT stated that the Waves price has reached a key horizontal support level at 11,500 satoshis and could initiate a bounce from here. дальше »
2020-1-10 18:35 | |
|
|

Bitcoin Analysis for 2019-11-08 [Premium]
The Bitcoin price is trading inside a horizontal channel with resistance and support at $9,800 and $9,000 respectively. If the current price decrease holds, it will have major bearish implications based on the daily time-frame and the channel breakdown. дальше »
2019-11-8 13:24 | |
|
|

Bitcoin and Litecoin Analysis for 2019-11-06 [Premium]
The Bitcoin price is trading inside a horizontal channel and an ascending triangle. According to our analysis, it is likely to break out from the triangle and reach the resistance line of the channel at $9,800. дальше »
2019-11-6 20:28 | |
|
|

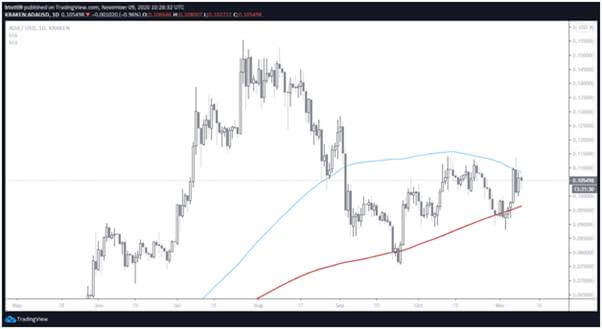
Bitcoin Analysis for 2019-11-05 [Premium]
The price of Bitcoin is trading inside a horizontal channel. Yesterday, it broke out from an ascending triangle but failed to sustain the breakout and is now back inside the triangle. We expect the price to continue trading inside this pattern. дальше »
2019-11-6 18:54 | |
|
|


Cardano Price Analysis: ADA Is Glaringly Impotent To Make A Notable Move
Major support level: horizontal support at $0. 039 Major resistance level: confluence of two Fib levels at $0. 052 Upside potential: picking up volume to slash through couple of Fib levels to reach the mentioned resistance Downside potential: dropping down to the support at $0. дальше »
2019-10-14 16:18 | |
|
|
Stellar Lumen Price Analysis: XLM To Break A Minor Resistance At 765 Sats
Major support zone: $0. 058 at horizontal line formed back in September Major resistance level: $0. 070 at Fib50 Upside potential: bursting through the intersection of two moving averages to touch on the resistance at $0. дальше »
2019-10-14 15:58 | |
|
|
Bitcoin Will Trade in a Range Throughout October, Claims Cryptocurrency Trader
Range trading occurs when the price of an asset consistently trades inside the confines of a high and low price. The highs and lows act as resistance and support, respectively. The most common pattern that gets created whenever the price trades in a range is the horizontal channel. дальше »
2019-10-12 22:12 | |
|
|
Bitcoin, Litecoin and Ripple’s XRP Price Prediction and Analysis for July 23rd: BTC, LTC, and XRP
Bitcoin Price Analysis (BTC/USD) Over the last 24hrs, BTC/USD pair has been trading on a sideways market. On an hourly chart, the horizontal channels that are acting as the pair’s price resistance level $10694. дальше »
2019-7-23 07:53 | |
|
|
NEO Price Prediction Today: Daily (NEO) Value Forecast – June 27
The NEO/USD market's bulls may potentially still muster their energy around the $16 mark. Meanwhile, the bears may not be able to sustain downward price movements below the aforementioned horizontal point. дальше »
2019-6-27 14:46 | |
|
|
ONTOLOGY Price Prediction Today: Daily (ONT) Value Forecast – June 18
The Ontology's market worth has been falling in a range against the price valuation of the US dollar in the medium-term run. There may soon be a line of consolidation price movements around $1. 40 horizontal price mark. дальше »
2019-6-18 12:10 | |
|
|
Ripple’s XRP Prediction 2019: XRP Is Suffocating While Defending An Important Support Zone (Mid May Update)
Mid May Update: Technicals XRPUSD daily chart shows a clear behaviour pattern for months now – XRP is ranging in a horizontal channel, bouncing up and down from $0. 29 to $0. 36 levels. It is easy to conclude that there is not enough power behind its moves upwards to rocket past the $0. дальше »
2019-5-13 01:22 | |
|
|
Ripple’s XRP Price Prediction 2019: XRP Is Suffocating While Defending An Important Support Zone (Mid May Update)
Mid May Update: Technicals XRPUSD daily chart shows a clear behaviour pattern for months now – XRP is ranging in a horizontal channel, bouncing up and down from $0. 29 to $0. 36 levels. It is easy to conclude that there is not enough power behind its moves upwards to rocket past the $0. дальше »
2019-5-13 01:22 | |
|
|
Ripple’s XRP Prediction 2019: Best Choice Right Now Is Not To Hold Any Position in XRP (Early May Update)
Early May Update: Technicals XRPUSD daily chart shows a clear behaviour pattern – XRP is ranging in a horizontal channel, bouncing up and down from $0. 29 to $0. 36 levels. It is easy to conclude that there is not enough power behind its moves upwards to rocket past the $0. дальше »
2019-5-6 17:09 | |
|
|
Ripple’s XRP Prediction 2019: It is do or die time for XRP (Early May Update)
Early May Update: Technicals XRPUSD daily chart shows a clear behaviour pattern – XRP is ranging in a horizontal channel, bouncing up and down from $0. 29 to $0. 36 levels. It is easy to conclude that there is not enough power behind its moves upwards to rocket past the $0. дальше »
2019-5-2 17:10 | |
|
|
Nano (NANO) Price Prediction 2019 – Fast and Sound Tech But Something is Missing (Late April Update)
Late April Update: Technicals NANOBTC daily chart shows that NANO has fallen through one newly and short-breathed horizontal support (former resistance line) and also one ascending trendline which now both act as resistance levels at 30090 and 31500 sats. дальше »
2019-4-28 14:49 | |
|
|
Ripple’s XRP Forecast 2019: It is do or die time for XRP (Late April Update)
April Update: Technicals XRPUSD daily chart shows a clear behaviour pattern – XRP is ranging in a horizontal channel, bouncing up and down from $0. 29 to $0. 36 levels. It is easy to conclude that there is not enough power behind its moves upwards to rocket past the $0. дальше »
2019-4-28 00:38 | |
|
|
BTC, ETH, XRP and BCH Price Watch: Today’s Cryptocurrency Chart Predictions
Bitcoin BTC/USD Price From yesterday’s low at $3936 the price of Bitcoin has increased today by 1.51% as it came to $3994.4 at its highest point today around which it is currently sitting. On the hourly chart, we can see that the price of Bitcoin has interacted with the horizontal resistance level and has found […] дальше »
2019-3-15 18:10 | |
|
|
Bitcoin (BTC), Ethereum (ETH), XRP (Ripple), and EOS Price Analysis Watch (Feb 19th)
Bitcoin BTC/USD From yesterday's open at $3708 the price of Bitcoin has increased by 7. 68% as its currently being traded at around $4010 where the price has encountered resistance around the $3994. дальше »
2019-2-19 18:27 | |
|
|
EOS Long-Term Price Forecast- February 16
EOS/USD Long-term Trend: Ranging Resistance levels: $ 6, $7, $8. Support levels: $3, $2, $1. The EOS/USD pair had been in a bearish trend zone after an initial range bound movement. In the month of January, EOS traded but fell from $2. дальше »
2019-2-16 08:52 | |
|
|
Ethereum (ETH) Daily Price Forecast – February 6
ETH/USD Medium-term Trend: Bearish Resistance Levels: $240, $250, $260 Support Levels: $100, $90, $80 Yesterday, February 5, the price of Ethereum was in a bearish trend zone. Since on February 3, the 12-day EMA and the 26-day EMA were in a horizontal pattern indicating that price was in a sideways trend. Yesterday as the crypto's […] дальше »
2019-2-6 09:51 | |
|
|

Bitcoin Price Analysis: Strong Move Likely Following Tightly Coiled Market
Days and days of sideways consolidation and tightening volume has been the name of the game for the bitcoin market. A narrow range of $200 has caused a weeks worth of activity to coil and consolidate in preparation for bitcoin’s next move:Figure 1: BTC-USD, Daily Candles, Narrow RangeThe figure above shows just how narrow the range has been over the last week as the market has continued to grind out support and fail to break above overhanging resistance. дальше »
2019-1-26 03:13 | |
|
|
Bitcoin Price Analysis: Range-Bound Market Coiled for Next Move
For the better part of a month and a half, bitcoin has been fairly range-bound and unable to establish new lows or new highs. There are some bullish and bearish setups on the horizon for bitcoin, so let’s check out both sides of the argument because currently the market is sitting in the middle of Indecisionville — the most immediate sign of which is this glaringly obvious head-and-shoulders bottom reversal pattern:Figure 1: BTC-USD, Daily Candles, Head-and-Shoulders BottomThis current pattern is nothing more than a setup at the moment, but it represents one potential outcome of this sustained consolidation. дальше »
2019-1-4 02:22 | |
|
|

Bitcoin Price Analysis: Bulls Defend Yearly Support Amidst Wall Street Slump
As Bitcoin price moves towards the second weekly close of October, we recap what happened during the week and look at the bullish versus bearish case for the number one cryptocurrency. 1 Day chart Bitcoin price has spent most of October in a tight range oscillating between lows of $6400 and highs of $6,650 as it continued a slow grind towards the horizontal resistance, which has capped the cryptocurrency’s price since January 2018. дальше »
2018-10-15 20:00 | |
|
|