2019-10-14 15:58 |
Major support zone: $0.058 at horizontal line formed back in SeptemberMajor resistance level: $0.070 at Fib50Upside potential: bursting through the intersection of two moving averages to touch on the resistance at $0.070Downside potential: dropping to the horizontal support at $.058. If that one fails to hold, we might revisit the local bottom at $.051
XLM is up by 2.73% on the day, trading at $0.063 or 756 satoshis.
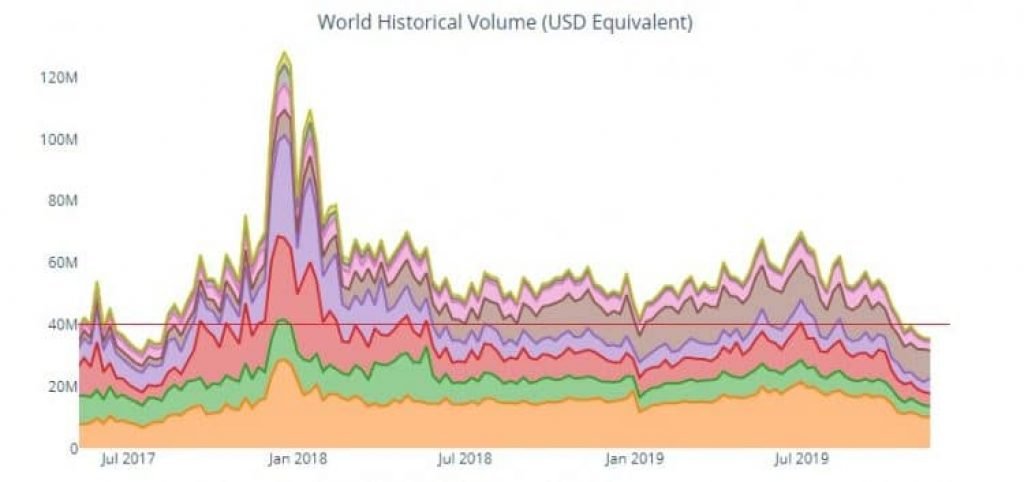
Since XLM price movements are highly susceptible to the market wide oscillations, we will first examine the total market cap before delving into the Stellar price analysis.
Total market cap analysisBroad crypto market is stuck in the area between $220 and $230 billions. If we plot a chart of its price action, we can see that the market is hovering above a strong support area of $214 billion (data from Tradinview, off by approx $8 billion to CMC data).
The price is squeezed between the EMA20 and horizontal support line at $216 billion.
If we zoom out and throw a glance on the weekly chart price action, we can see that the price might touch on the Fib382 level at $205 before bouncing back up to the Fib50 at $240 billion.
We need to take this into account before charting any individual coin price action.
Read our updated review of Cex.io exchange here.
XLMUSDMajor support zone: $0.058 at horizontal line formed back in SeptemberMajor resistance level: $0.070 at Fib50Upside potential: bursting through the intersection of two moving averages to touch on the resistance at $0.070Downside potential: dropping to the horizontal support at $.058. If that one fails to hold, we might revisit the local bottom at $.051Read our updated review of Coinmama exchange here.
XLM is trading on a very low volume, which is the first precondition if we are to expect any kind of a bull move for Stellar. However, since the broad market sentiment is not too great, a slight dip down for the whole market is likely before we can see some greenery and bull actions.
XLMBTCXLM gained solid ground on BTC in the last 30 days, being up by 33%. It is also outpacing BTC in the last 24 hours as well, up by 3% on the leading crypto coin.
XLM is gliding above the EMA20 on the daily XLMBTC chart, trying to reach first notable obstacle which is the Fib236 at 884 satoshis.
If we zoom in to the lower time-frames, we can see Stellar mounting a third attempt to break the 767 sats zone, a Fib618 level of the high-low swing of 898 sats to 551 sats (September high-lows).
Read our updated guide on best cryptocurrencies to mine.
If it fails to break it, it would probably tumble down to the MA200 or Fib382 zone at around 680 satoshis.
Upside potential should the breakthrough succeed is reaching the aforementioned 884 sats height, a medium-strong resistance level.
The post Stellar Lumen Price Analysis: XLM To Break A Minor Resistance At 765 Sats appeared first on CaptainAltcoin.
origin »Bitcoin price in Telegram @btc_price_every_hour
Stellar (XLM) на Currencies.ru
|
|