Новости о Bollinger Bitcoin [ Фото новости ] [ Свежие новости ] | |

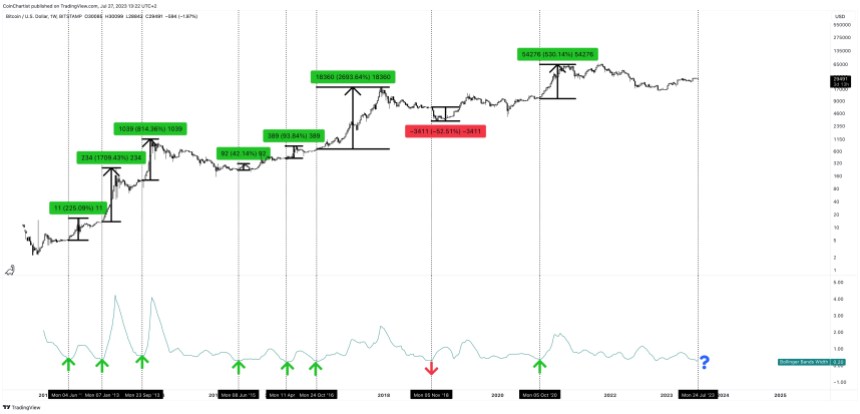
Bitcoin Bollinger Bands Are The Tightest Ever, What Happens Next?
Last week, the 1W Bollinger Bands in Bitcoin reached its tightest level ever. The volatility measuring tool typically doesn’t give any indication of direction, however. Using historical data, we’ve taken all previous instances of extreme lows and the resulting direction — up and down — and discovered the success rate of the signal. дальше »
2023-8-2 22:25 | |
|
|
Major Crypto Assets Are Preparing For Powerful Volatility Against Bitcoin
Although there were some early signs that an altcoin season may be upon us, top crypto assets like Ethereum have been reverted to weakening performance against Bitcoin. However, a big move is potentially coming, as the Bollinger Band Width of most major crypto assets on their BTC trading pairs is indicating a distinct lack of... дальше »
2020-5-30 23:00 | |
|
|
Bitcoin, Ethereum's NVT creeps into neutral territory as uncertainty prevails
The world's largest altcoin, Ethereum, was trading at a price of $156, at the time of writing, following a period of volatility, something confirmed by the diverging Bollinger Bands on the charts. дальше »
2020-4-15 20:30 | |
|
|
Analysts Fear the Worst as Bitcoin Price Readies to See 20% Breakout
Over the past week, Bitcoin has found itself flatlining, establishing a tight range in the low-$7,000s as volume tapers off. This consolidation has forced the Bollinger Bands, a moving average-based technical analysis tool often used by traders looking for more information about trading ranges and volatility, for Bitcoin to reach extremely tight levels, implying that. дальше »
2019-12-16 22:30 | |
|
|
Analysts expect Bitcoin to falter as price fails to break past low-$7,000s
Over the past week, Bitcoin has found itself flatlining, establishing a tight range in the low-$7,000s as volume tapers off. This consolidation has forced the Bollinger Bands, a technical analysis tool often used by traders looking for more information about trading ranges and volatility, for Bitcoin to reach “squeeze” levels, implying that volatility is on […] The post Analysts expect Bitcoin to falter as price fails to break past low-$7,000s appeared first on CryptoSlate. дальше »
2019-12-15 10:33 | |
|
|

Cryptocurrency Bollinger Band Squeeze Will Spur Next Big Move
Technical indicators are getting to that stage where another big move is becoming imminent on cryptocurrency markets. After several weeks of consolidation this is usually the case which leaves us with the big question; up or down? Bitcoin Still in Slumber Very little has happened on BTC markets over the past day or so. дальше »
2019-12-14 07:00 | |
|
|


Analyst That Called Bitcoin Surge to $10,000 Suggests Bottom is Nearing
In the middle of October, John Bollinger, the prominent technical analyst behind the Bollinger Bands indicator, remarked that Bitcoin (BTC) was going to see a so-called “head fake. ” For those unaware, a head fake in technical analysis terms is when an asset falls out of the Bollinger Bands, an indicator that estimates trading ranges, then. дальше »
2019-11-26 10:39 | |
|
|
Bitcoin Price to Bottom in Mid-November at Around $6,700: Analysis
Bitcoin took an absolute beating on Wednesday. For those who missed the memo, the cryptocurrency saw a 10% drop within an hour or two, plunging under the key level of $7,700 for the first time in around five months. дальше »
2019-10-24 15:00 | |
|
|

Bitcoin Price: Tightening Technicals Signal Big Move
Bitcoin price has spent another day trading within its range-bound channel at around $8,200. The sideways action has been going on for almost a month now and technical indicators are starting to align with a signal for the next big move. дальше »
2019-10-22 10:00 | |
|
|
After 3 weeks of stagnation, traders say Bitcoin poised to see big volatility
Following three weeks of stagnation, technical analysts anticipate the bitcoin price to see large volatility in the short term as it looks to test important levels. Cryptocurrency trader Josh Rager said: “With three weeks of sideways and the Bollinger Bands starting to pinch, Bitcoin price could see some volatility soon Good news is that the […] The post After 3 weeks of stagnation, traders say Bitcoin poised to see big volatility appeared first on CryptoSlate. дальше »
2019-10-14 14:33 | |
|
|

Bitcoin Price Flatlines at $8.4K as Bollinger Bands Predict Breakout
Bitcoin failed to break resistance at $8.8K but XRP and ETH are now showing signs of a possible recovery
дальше »2019-10-14 21:55 | |
|
|
Bollinger Bands Creator Believes the Crypto Market Has Less Noise
John Bollinger, the creator of the widely used Bollinger Bands, has revealed that he has been in the crypto market for over three years. In an interview with Forbes, August 22, 2019, Bollinger revealed he entered cryptocurrency because he saw that it operated with less noise than the stock market. дальше »
2019-8-23 13:00 | |
|
|

Bitcoin Price Analysis: Reaccumulation Breakout Hints at Bullish Continuation
Summary:Bitcoin clearly broke upward out of reaccumulation trading that had spent three weeks consolidating sideways. The market has begun to drift into a zone of supply between the $5,700 and $6,000 levels. дальше »
2019-4-24 22:22 | |
|
|
Bollinger Bands Are Getting Very Tight
Bitcoin volatility has considerably reduced with the biggest crypto maintaining a price above $5,000 in a sideways movement for the past few days. One of the most popular measure of... The post Bollinger Bands Are Getting Very Tight appeared first on Trustnodes. дальше »
2019-4-15 17:04 | |
|
|


Bitcoin Price Analysis: Major Support Broken on Expanding Volume and Spread
After weeks of consolidation, bitcoin finally broke through support. The market now finds itself cruising toward prior lows. On expanding volume and spread, the bitcoin market appears ripe for a continuation of the downtrend:Figure 1: BTC-USD, Daily Candles, Broken SupportAlthough the current daily candle has yet to close, unless there is a strong influx of demand hitting the market, it stands to reason that bitcoin will be closing a new daily low for the first time since mid-December. дальше »
2019-1-29 02:01 | |
|
|
Bitcoin Price Analysis: Strong Impulse Tests Macro Support Levels
Finally, after about a week or so of a tight, range-bound market, bitcoin poked right through support. This swift move dropped the price nearly 10% in the span of just a few short hours:Figure 1: BTC-USD, Hourly Candles, 11% DropNot only did this move occur on high spread, it occured on high volume. дальше »
2019-1-12 02:21 | |
|
|

Bitcoin Price Analysis: Another Red Day Pushes BTC Into Deeper Support Test
Bitcoin has tumbled again today as the market continues to see further downward movement shortly after breaking two areas of market support. So far, bitcoin is down 15% on the day — 25% in 1 week:Figure 1: BTC-USD, Daily Candles, Downward ContinuationThis drop below support is starting to display hallmarks of market capitulation. дальше »
2018-11-20 02:27 | |
|
|
Bitcoin Price Analysis: Weekly Consolidation Hints Toward Sustained Breakout
Another week has passed as bitcoin continues to coil in a tighter and tighter consolidation. Both price and volume continue to consolidate as bitcoin decides where the next major move will be. дальше »
2018-10-31 00:19 | |
|
|
Bitcoin Price Analysis: Bitcoin Consolidation Forecasts $3,500 Move
A strong round of buys hit the market this weekend as unsubstantiated rumors began to circle surrounding Tether and Bitfinex’s potential insolvency. I won’t be going into the details surrounding the allegations because, like I said, they are nothing more than unsubstantiated rumors. дальше »
2018-10-17 01:03 | |
|
|
Signs That The Bears Are Taking Over Bitcoin
After the market crash on Thursday, the future of a further drop in Bitcoin seems to be a bit brighter according to CoinDesk. The biggest digital currency in the world has been staying relatively steady over the past month but on Thursday there was a massive drop bringing the price down below the $6,500 mark and to the $6,200 level confirming a range breakdown. дальше »
2018-10-13 21:30 | |
|
|
Bitcoin Price Analysis - Large move soon
Volatility continues to grind lower as we approach Q4. The leading bias of any upcoming move, as well as a bullish and bearish roadmap, can be determined using Bollinger Bands, Pitchforks, exponential moving averages, Wyckoff Method, chart patterns, and the Ichimoku Cloud. дальше »
2018-10-5 14:01 | |
|
|
Bitcoin Price Volatility Hits Lowest Level In Nearly 2 Years
Bitcoin price volatility, as indicated by Bollinger band width, has hit the lowest level since December 2016. дальше »
2018-9-26 14:11 | |
|
|
Bitcoin Price Analysis: High Shorts Count Could Signal Price Hike
Once again, bitcoin finds itself precariously perched on the bottom of its macro trading range (TR). After a strong round of selling over the course of two weeks plunged the price back to the $6,000s, bitcoin began consolidating for several weeks at the bottom of the TR:Figure 1: BTC-USD, 1-Day Candles, Macro TRAs shown in the figure above, the market has interacted several times at the current price range and it has been a source of three major bullish rallies. дальше »
2018-8-25 00:42 | |
|
|

5 Reasons Why XRP is Still A Better Bet Than Other Alts and even Bitcoin (BTC)
The recent announcement that Ripple has partnered with the three exchanges of Bittrex, Bitso and Coins. ph, is partly the reason XRP has recovered from one of its lowest lows this year. August 14th found XRP valued at $0. дальше »
2018-8-18 16:13 | |
|
|

Bitcoin Rally hits a speed breaker for $ 6750
Bitcoin (BTC) needs to overcome a key technical resistance to keep the short-term bull market going, the technical studies indicate. Further, a detailed look at the technical charts reveals the area around $6,754 is packed with moving average lines and Bollinger Band, all working in unison to put brakes on BTC price rally. Hence, a дальше »
2018-7-5 16:39 | |
|
|

Wikipedia Price rally hits the push speed pump to $ 7K
Bitcoin (BTC) needs to overcome a key technical resistance to keep the short-term bull market going, the technical studies indicate. Further, a detailed look at the technical charts reveals the area around $6,754 is packed with moving average lines and Bollinger Band, all working in unison to put brakes on BTC price rally. Hence, a дальше »
2018-7-5 16:28 | |
|
|
