Bitcoin Bollinger Bands Are The Tightest Ever, What Happens Next?

Bitcoin Bollinger Bands Are The Tightest Ever, What Happens Next?
фото показано с : newsbtc.com

2023-8-2 22:25

Last week, the 1W Bollinger Bands in Bitcoin reached its tightest level ever. The volatility measuring tool typically doesn’t give any indication of direction, however.

Using historical data, we’ve taken all previous instances of extreme lows and the resulting direction — up and down — and discovered the success rate of the signal.

Bollinger Band Width Reaches Historical Lows: What Does It Mean?

The Bollinger Bands are a complete trading system, designed by John Bollinger in the 1980s — an avid Bitcoin speculator. The tool uses a 20-period simple moving average (SMA) and two bands set at two standard deviations of the SMA.

As such, the “Bands” expand and contract based on volatility — a measure of how aggressively price moves within a time period. When the Bands tighten to extremes, it indicates a period of low volatility. This setup is called a Squeeze, which ultimately releases pent up energy and results in a large move. When price action picks up, the bands expand to represent the return of volatility.

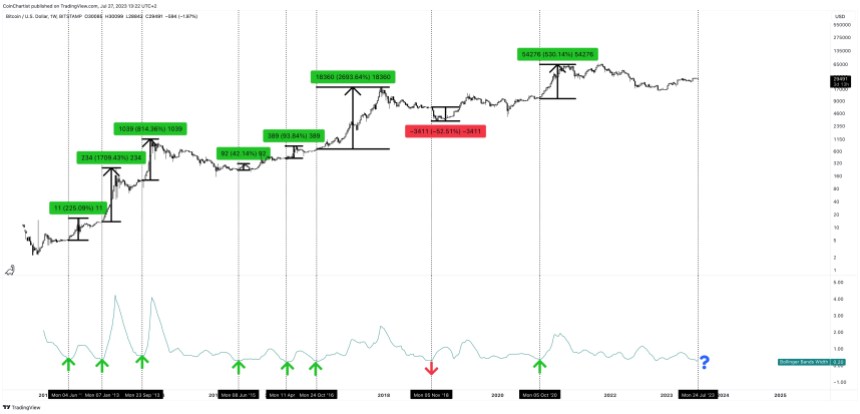
According to Bollinger Band Width, a related tool designed to tell analysts how tight the bands on an easier to visually compare basis, the Bollinger Bands in BTCUSD are the tightest in the history of crypto. Notably, Ethereum and the TOTAL crypto market cap are also historically tight.

The technical indicator, however, doesn’t say anything about direction, only that something big is on the way. In the past, Bitcoin has broken out in either direction. But how many of these times were up? And how far did it climb?

Bitcoin Breakout Performance Analyzed: Average 669% ROI When Volatility Returns

Past performance is never a guarantee of future results, but from historical price data we can better understand the behavior in BTCUSD after such low volatility phases.

Of the nine total instances the Bitcoin weekly Bollinger Bands got this tight, the top cryptocurrency by market cap rallied upward after upon breakout seven times. The average upward movement across all seven times is 872%. In contrast, the two down moves resulted in an average crash of 40%.<

Bitcoin falling 40% from here would take it back to $17,500 per coin, while a 872% move higher would take BTCUSD to over $280,000 per coin. The average of up and down moves resulted in a grand total of 669%, which would take the number one cryptocurrency to over $220,000. Considering the rule of diminishing returns, such a strong move is unlikely. However, the data speaks to the magnitude of the move that could occur, once volatility returns.

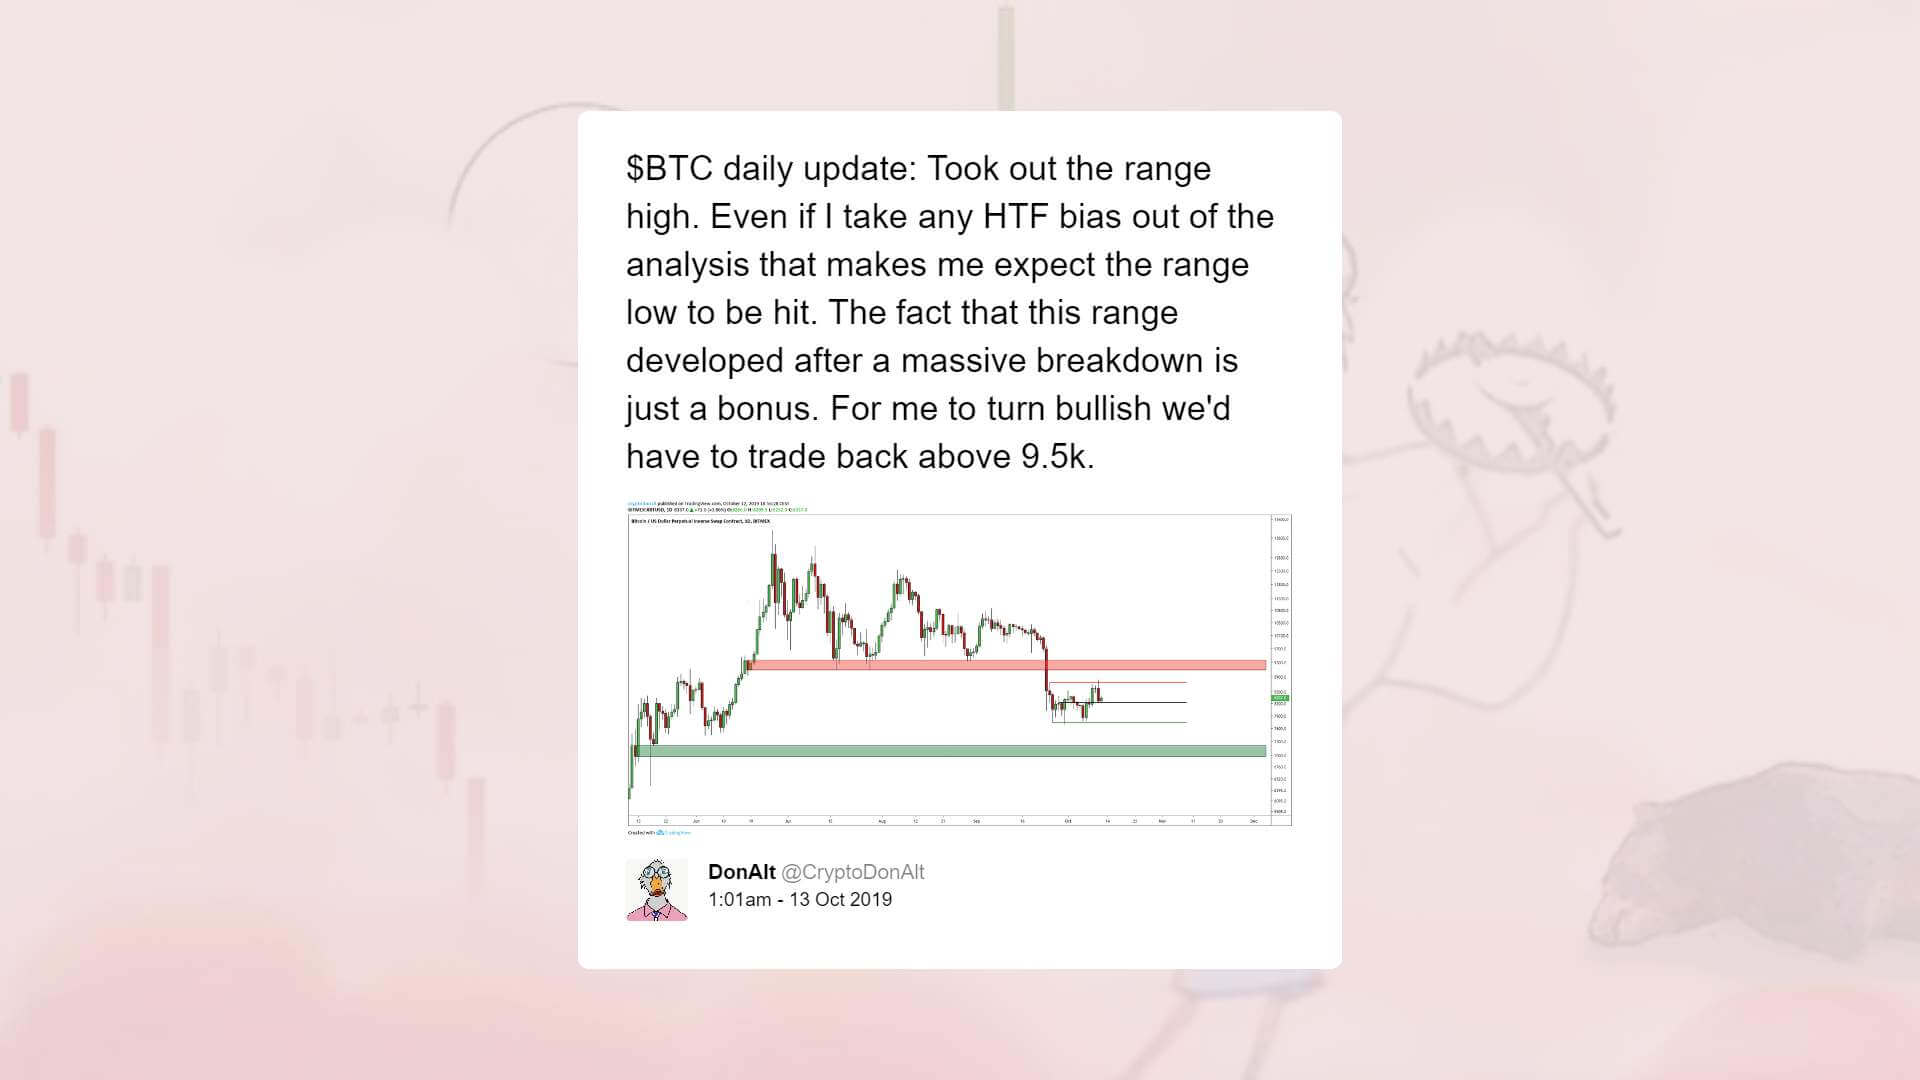
As long as #Bitcoin remains above the weekly Bollinger Band basis –– a 20-period SMA –– I am bullish

Lose the mid-BB and then I’ll talk downside pic.twitter.com/knOo0oMW5M

— Tony “The Bull” (@tonythebullBTC) July 28, 2023

Similar to Notcoin - TapSwap on Solana Airdrops In 2024

origin »

Bitcoin (BTC) на Currencies.ru

$ 62947.35 (-0.28%)
Объем 24H $27.735b
Изменеия 24h: 3.04 %, 7d: -0.79 %
Cегодня L: $62934.42 - H: $63088.03
Капитализация $1239.93b Rank 1
Цена в час новости $ 29412.28 (114.02%)

bollinger bitcoin ever direction bands tightest taken

bollinger bitcoin → Результатов: 104


Analysts Fear the Worst as Bitcoin Price Readies to See 20% Breakout

Over the past week, Bitcoin has found itself flatlining, establishing a tight range in the low-$7,000s as volume tapers off. This consolidation has forced the Bollinger Bands, a moving average-based technical analysis tool often used by traders looking for more information about trading ranges and volatility, for Bitcoin to reach extremely tight levels, implying that.

2019-12-16 22:30


Analysts expect Bitcoin to falter as price fails to break past low-$7,000s

Over the past week, Bitcoin has found itself flatlining, establishing a tight range in the low-$7,000s as volume tapers off. This consolidation has forced the Bollinger Bands, a technical analysis tool often used by traders looking for more information about trading ranges and volatility, for Bitcoin to reach “squeeze” levels, implying that volatility is on […] The post Analysts expect Bitcoin to falter as price fails to break past low-$7,000s appeared first on CryptoSlate.

2019-12-15 10:33


Analyst That Called Bitcoin Surge to $10,000 Suggests Bottom is Nearing

In the middle of October, John Bollinger, the prominent technical analyst behind the Bollinger Bands indicator, remarked that Bitcoin (BTC) was going to see a so-called “head fake. ” For those unaware, a head fake in technical analysis terms is when an asset falls out of the Bollinger Bands, an indicator that estimates trading ranges, then.

2019-11-26 10:39


Фото:

After 3 weeks of stagnation, traders say Bitcoin poised to see big volatility

Following three weeks of stagnation, technical analysts anticipate the bitcoin price to see large volatility in the short term as it looks to test important levels. Cryptocurrency trader Josh Rager said: “With three weeks of sideways and the Bollinger Bands starting to pinch, Bitcoin price could see some volatility soon Good news is that the […] The post After 3 weeks of stagnation, traders say Bitcoin poised to see big volatility appeared first on CryptoSlate.

2019-10-14 14:33


Фото:

Bitcoin Price Analysis: Major Support Broken on Expanding Volume and Spread

After weeks of consolidation, bitcoin finally broke through support. The market now finds itself cruising toward prior lows. On expanding volume and spread, the bitcoin market appears ripe for a continuation of the downtrend:Figure 1: BTC-USD, Daily Candles, Broken SupportAlthough the current daily candle has yet to close, unless there is a strong influx of demand hitting the market, it stands to reason that bitcoin will be closing a new daily low for the first time since mid-December.

2019-1-29 02:01


Фото:

Bitcoin Price Analysis: High Shorts Count Could Signal Price Hike

Once again, bitcoin finds itself precariously perched on the bottom of its macro trading range (TR). After a strong round of selling over the course of two weeks plunged the price back to the $6,000s, bitcoin began consolidating for several weeks at the bottom of the TR:Figure 1: BTC-USD, 1-Day Candles, Macro TRAs shown in the figure above, the market has interacted several times at the current price range and it has been a source of three major bullish rallies.

2018-8-25 00:42