2021-9-29 21:10 |
Bitcoin (BTC) has been rejected by the $44,000 resistance area.
Ethereum (ETH) is trading inside a descending wedge.
XRP (XRP) is following a descending support line.
OKB (OKB) has bounced at the $9.80 horizontal support area.
Cardano (ADA) is attempting to hold on above the $2.05 horizontal support area.
Stellar (XLM) has bounced at the $0.26 horizontal support area.
Neo (NEO) has broken out from a very short-term descending wedge.
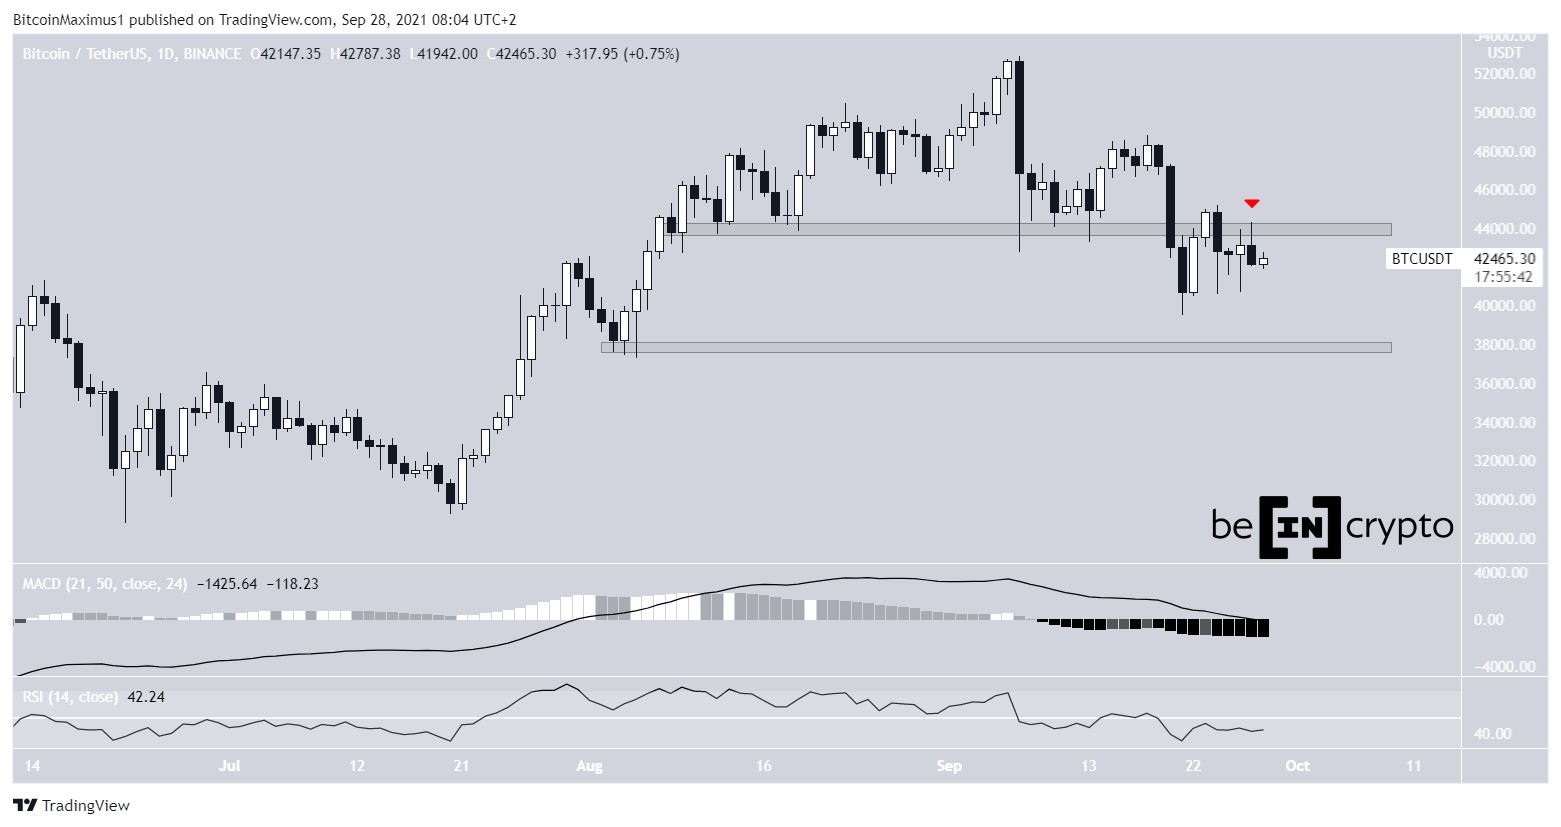
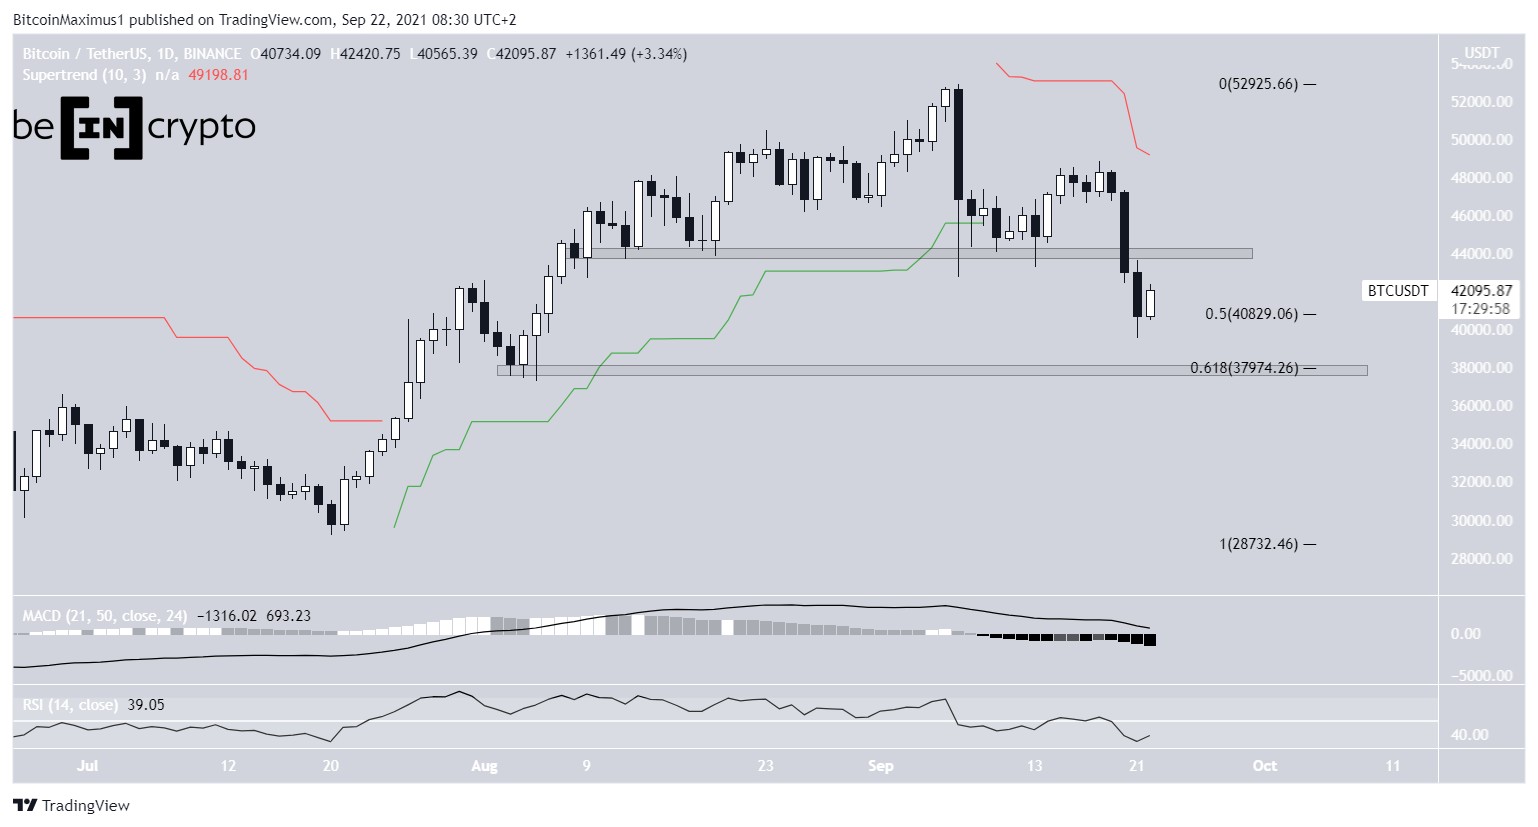
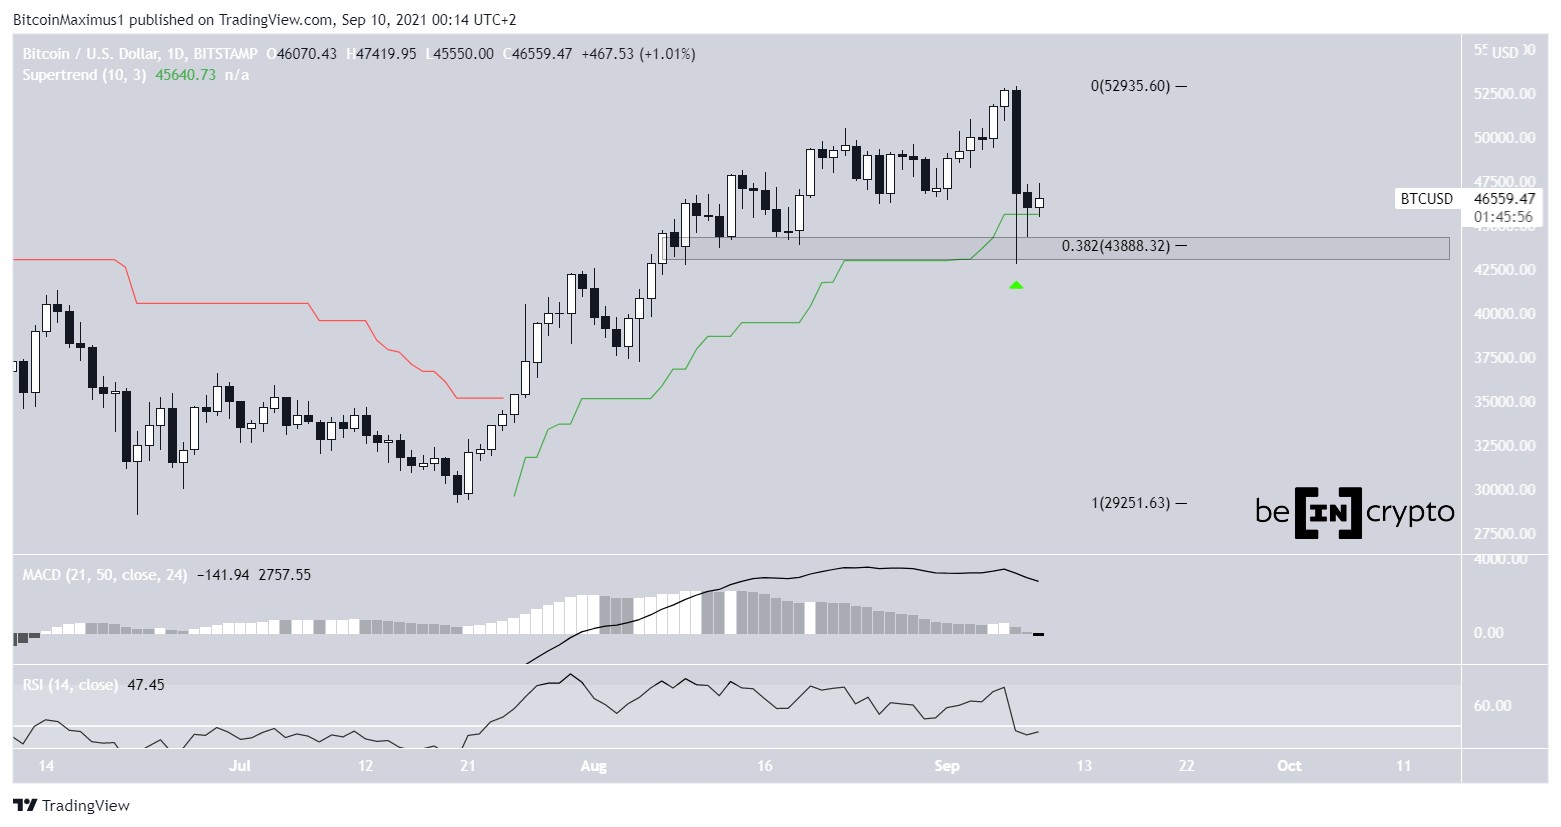
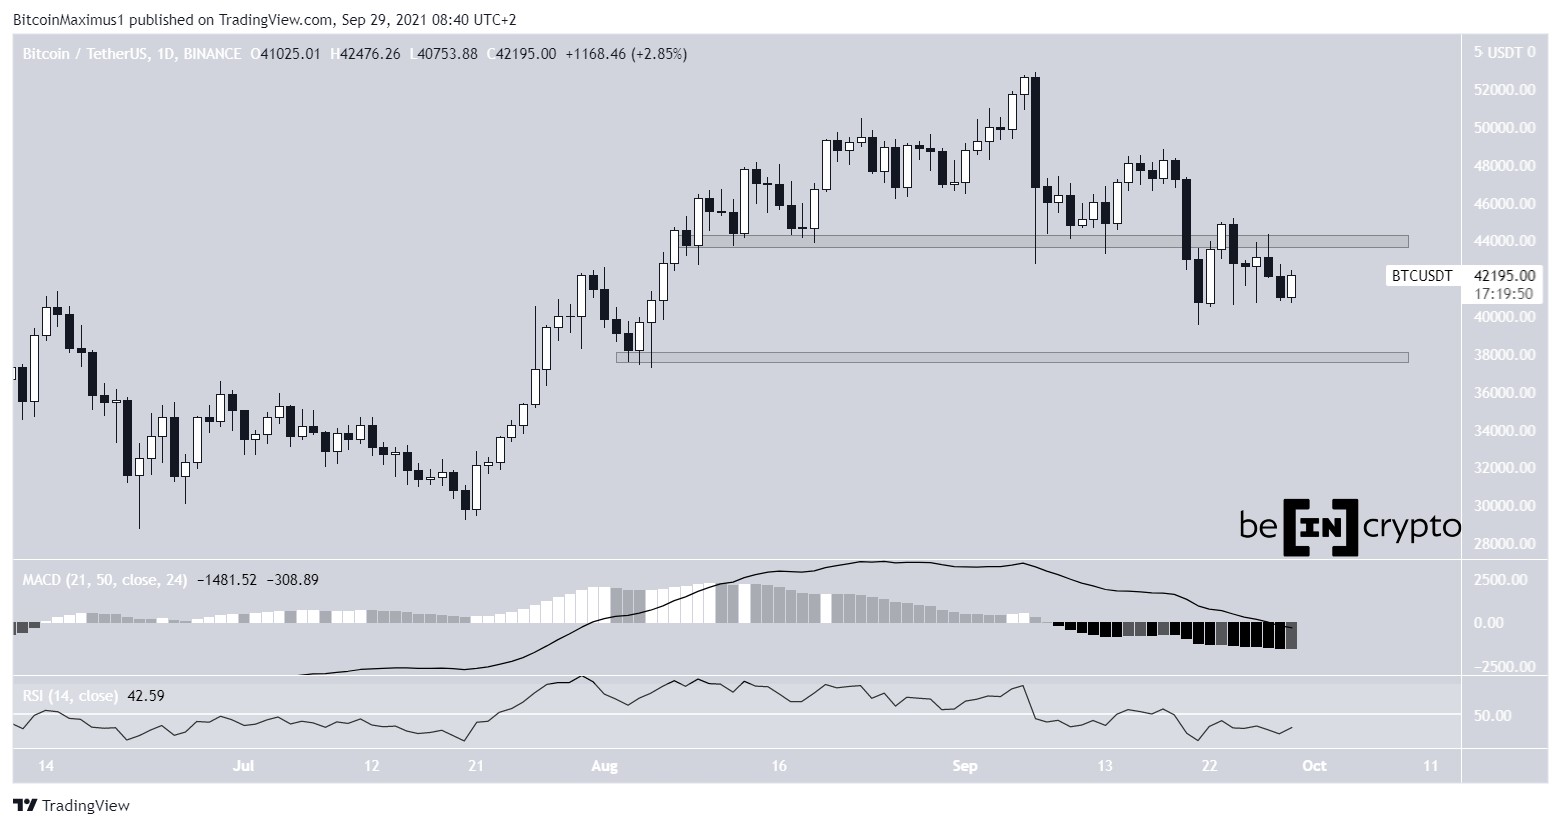
BTCBTC has been moving downwards since Sept 27, when it was rejected by the $44,000 resistance area. The same day, it created a bearish candlestick and a long upper wick.
Currently, it is trading just above $42,200, inside the wick support from Sept 24 and 26.
However, technical indicators in the daily time-frame are bearish, since both the RSI and MACD are decreasing.
The closest support area is at $38,000.
Chart By TradingView ETHETH has been trading inside what looks like a descending wedge since Sept 3. It was rejected by its resistance line on Sept 16, and proceeded to reach a low of $2,650 on Sept 21.
While the wedge is considered a bullish pattern, technical indicators are relatively neutral. The MACD is increasing, but it is below 0, while the RSI is right at the 50 line.
So, the direction of the trend is unclear.
Chart By TradingView XRPXRP has been decreasing alongside a descending support line since Aug 17. Most recently, it touched the line on Sept 21, and initiated a slight bounce. The validation of the line coincides with the $0.85 support area, which is the 0.618 Fib retracement support level.
Despite the bounce, technical indicators are neutral. The MACD and RSI are both increasing, but the former is below 0 and the latter is below 50.
Therefore, similarly to ETH, the direction of the trend is unclear.
Chart By TradingView OKBOKB has been moving downwards since Aug 8. On Sept 26, it bounced at the $9.80 horizontal support area and created a long lower wick in the process (green icon).
It has been moving upwards since and is currently trading at $16.25. The upward movement is supported by both the RSI and MACD.
The closest resistance area is at $24.
Chart By TradingView ADAADA has been decreasing since Sept 2, when it reached an all-time high price of $3.09. Since then, it has been decreasing underneath a descending resistance line.
Since then, it has twice bounced at the $2.05 support, which is the 0.5 Fib retracement support level and a horizontal support area.
Each bounce has been weaker than the preceding one, a bearish sign. Furthermore, the MACD and RSI are both falling.
If a breakdown occurs, the next support would be at $1.45.
Chart By TradingView XLMXLM has been decreasing alongside a descending resistance line since Sept 15. On Sept 21, it reached the $0.26 support area and initiated a small bounce.
While it has been trading close to the same support area since, there is a bullish divergence developing in both the RSI and MACD.
Therefore, a breakout from this resistance line would be likely.
If one occurs, the next resistance would be at $0.34.
Chart By TradingView NEONEO has been decreasing inside a descending wedge since Sept 23. Most recently, it bounced at its support line on Sept 29 and broke out afterwards. The breakout is supported by both the MACD and RSI.
The closest resistance area is at $40. This is the 0.5 Fib retracement resistance level.
If NEO manages to move above it, it would likely head towards the $44.30 highs.
Chart By TradingViewFor BeInCrypto’s latest Bitcoin (BTC) analysis, click here.
The post BTC, ETH, XRP, OKB, ADA, XLM, NEO – Technical Analysis Sept 29 appeared first on BeInCrypto.
origin »Bitcoin price in Telegram @btc_price_every_hour
Bitcoin (BTC) на Currencies.ru
|
|