2021-9-1 22:35 |
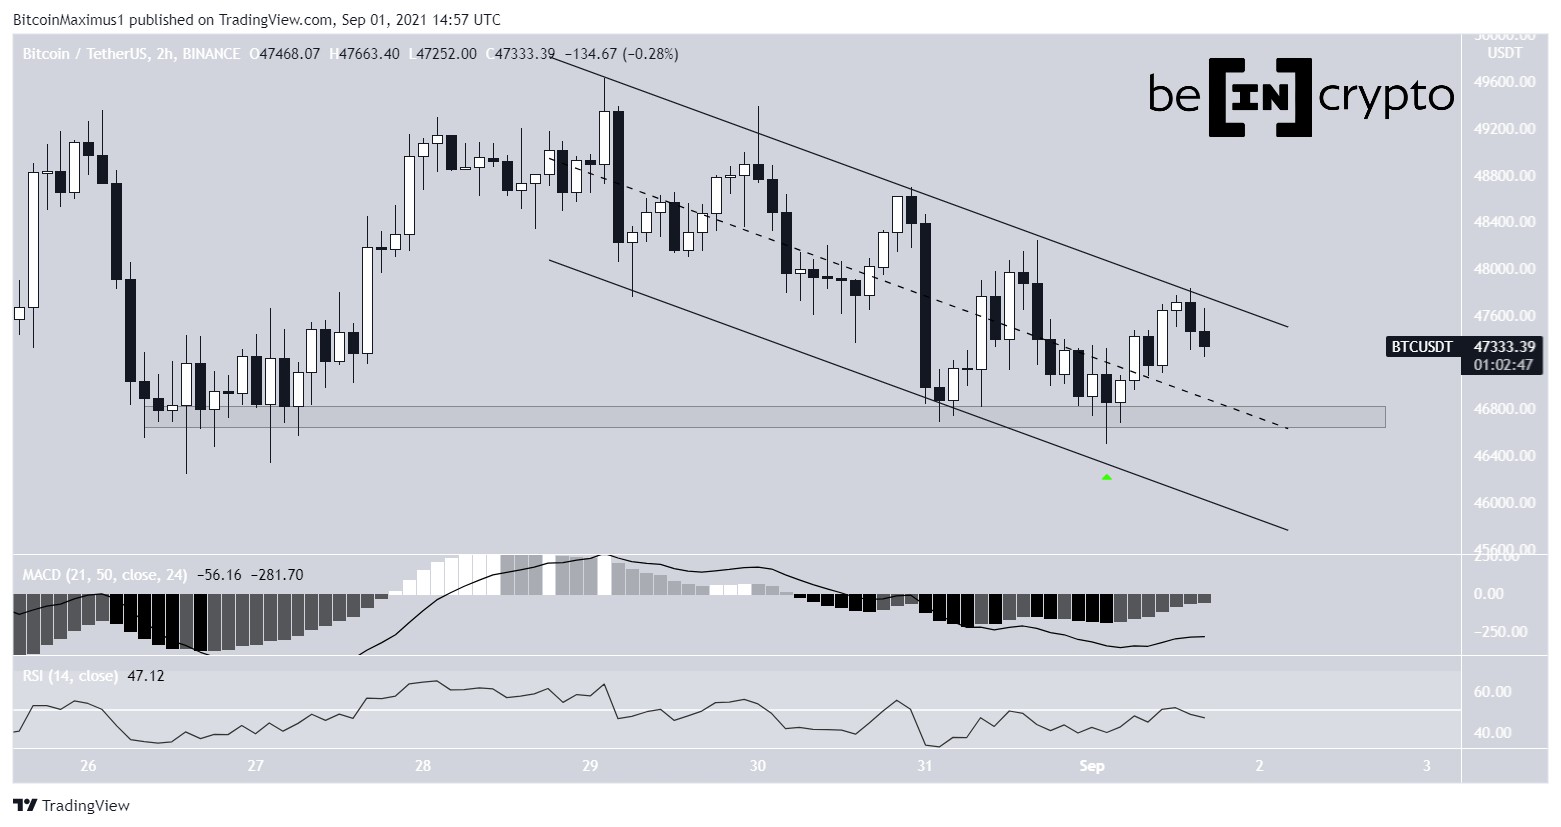
Bitcoin (BTC) is in the process of breaking out from a descending parallel channel.
Ethereum (ETH) has broken out from the $3,375 resistance area.
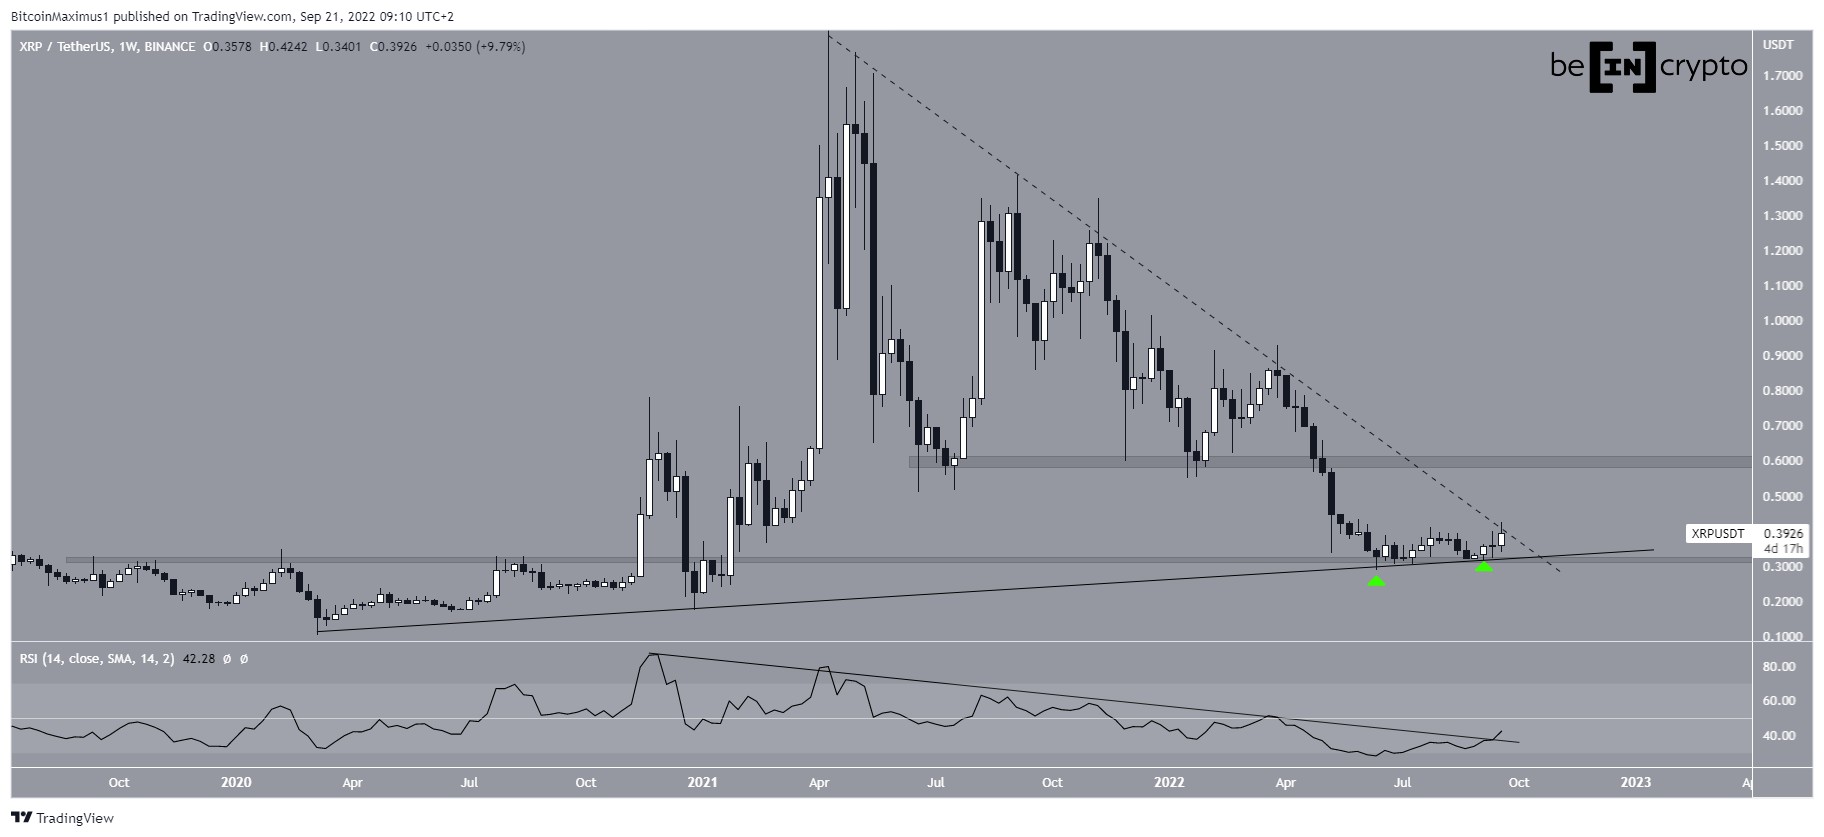
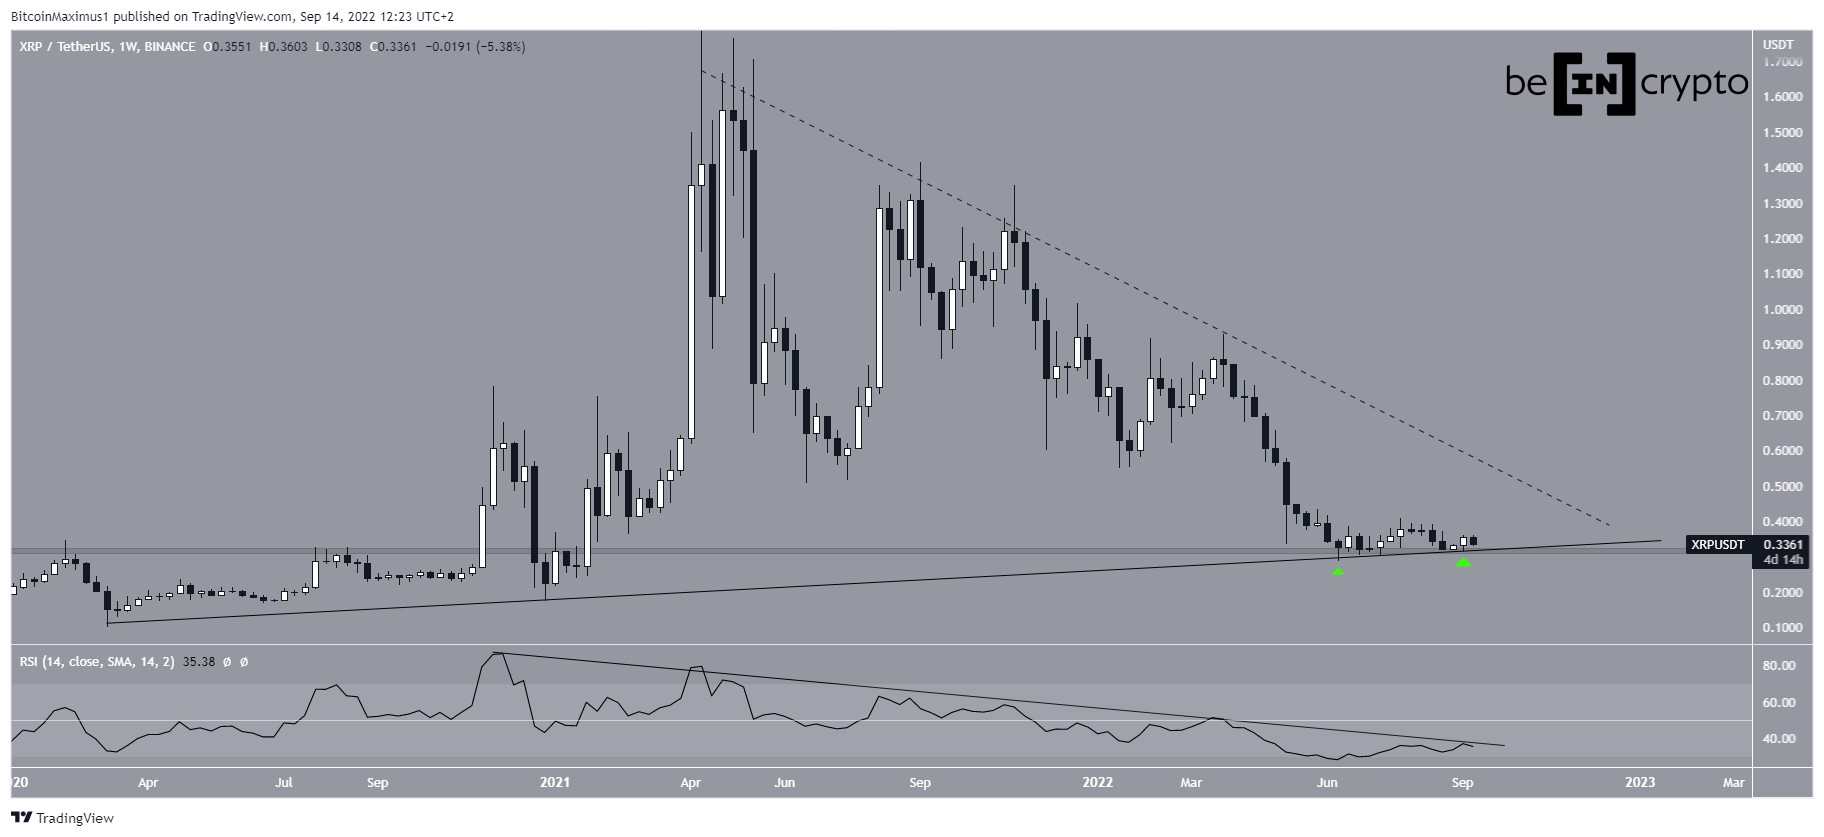
XRP (XRP) is trading inside a symmetrical triangle.
Terra (LUNA) reached a new all-time high price on Aug. 29.
Polkadot (DOT) and Uniswap (UNI) have reclaimed horizontal resistance levels.
Ankr (ANKR) has broken out from a descending parallel channel.
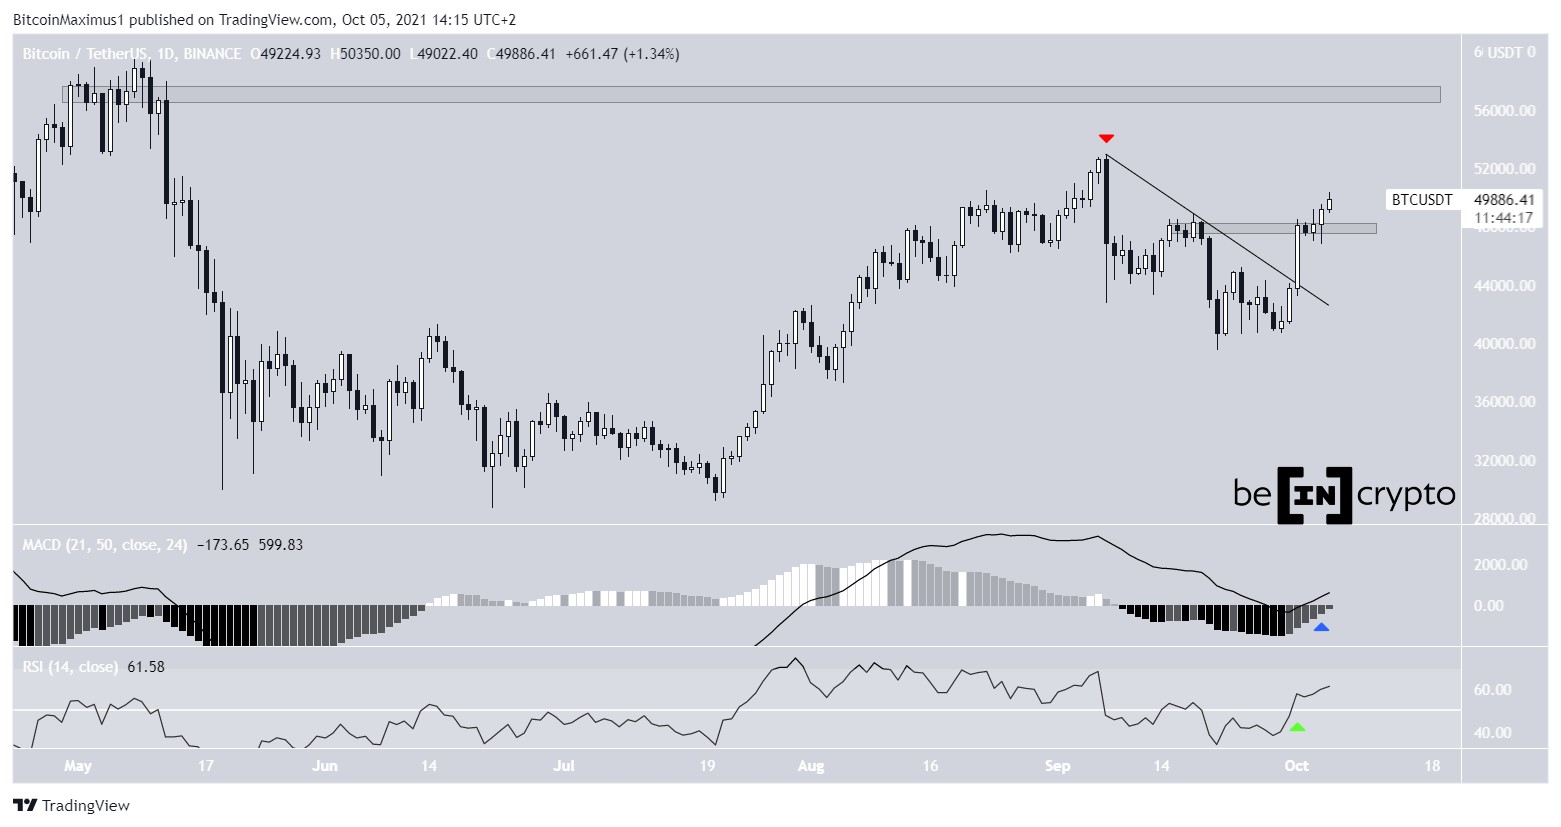
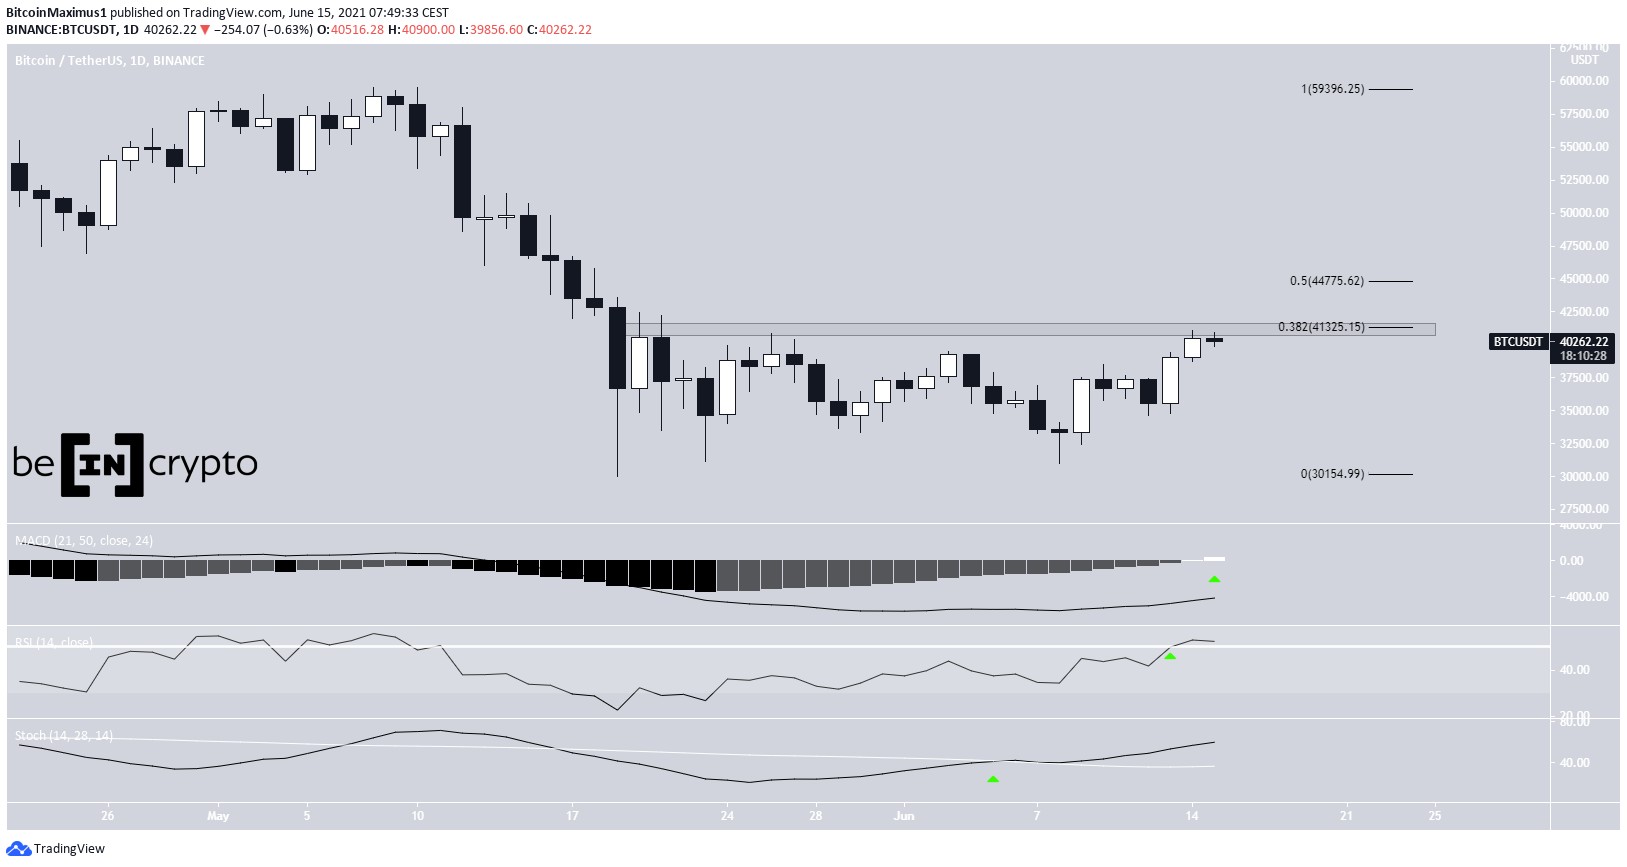
BTCBTC has been decreasing inside a short-term descending parallel channel since Aug. 29. Such channels usually contain corrective structures.
On Sept. 1, BTC briefly swept the lows below $46,800 before reclaiming the horizontal support area.
The MACD and RSI are both gradually turning bullish. Therefore, an eventual breakout is likely.
For a longer-term analysis, click here.
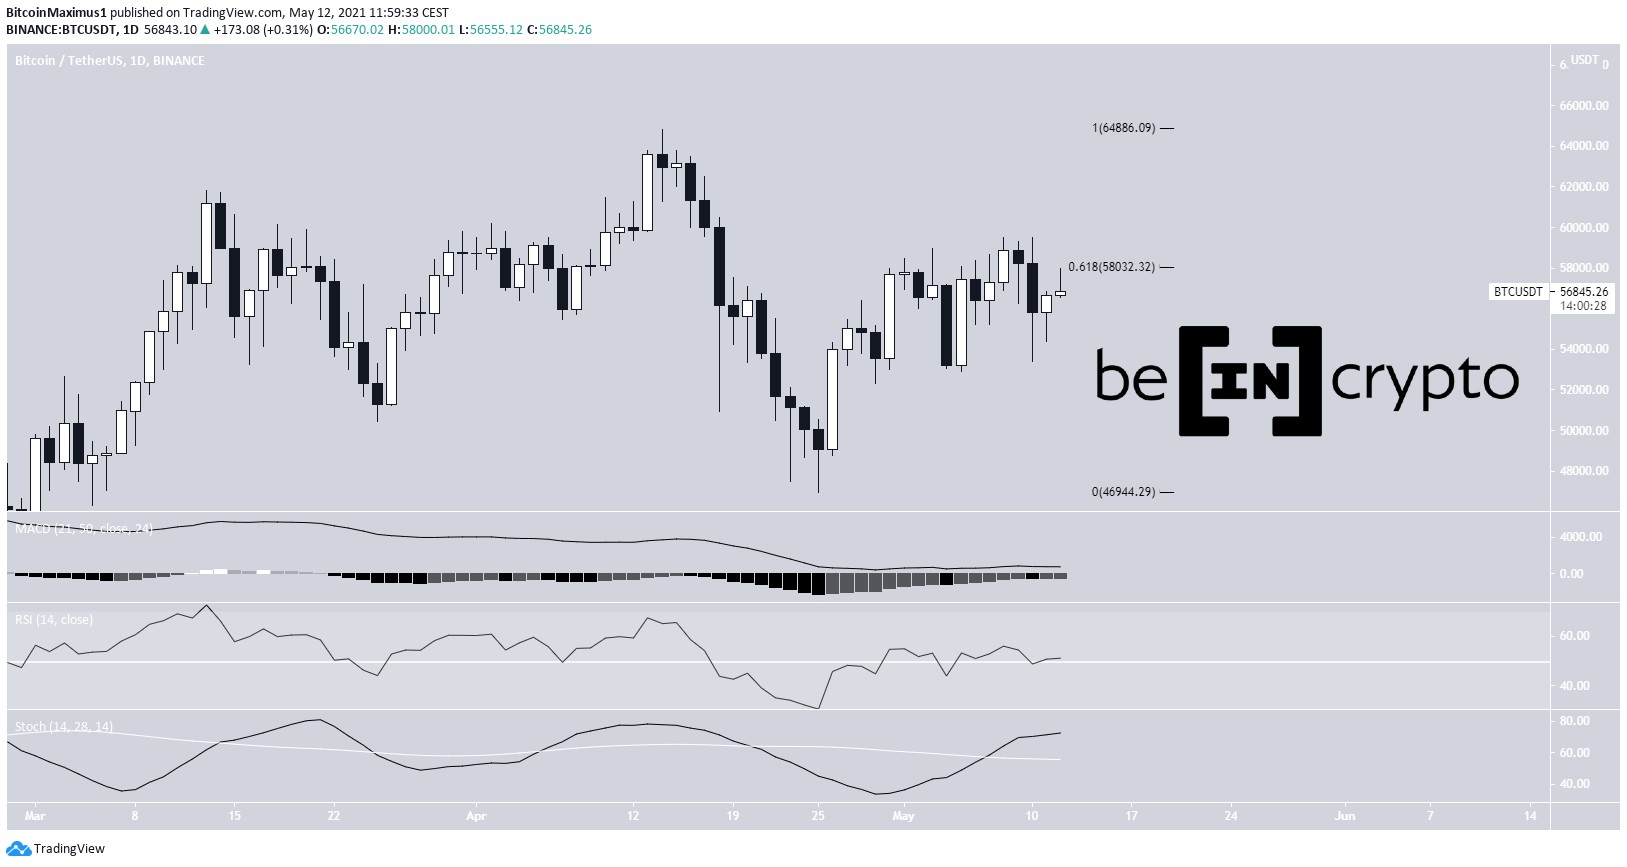
Chart By TradingView ETHETH has been moving upwards since July 20, when it was trading at a low of $1,706. On Aug. 13, it reached a high of $3,327 but was rejected by the 0.618 Fib retracement resistance level at $3,375.
After consolidating for 18 days, ETH broke out on Aug. 31.
It seems that the movement is part of wave five of a bullish impulse.
The most likely target for the top of the movement is between $3,761 and $3,813. The target is found by projecting the length of wave one (black) and the 0.382 length of waves 1-3 (orange).
The next most likely target is at $4,150, followed by a potential new all-time high at $4,775.
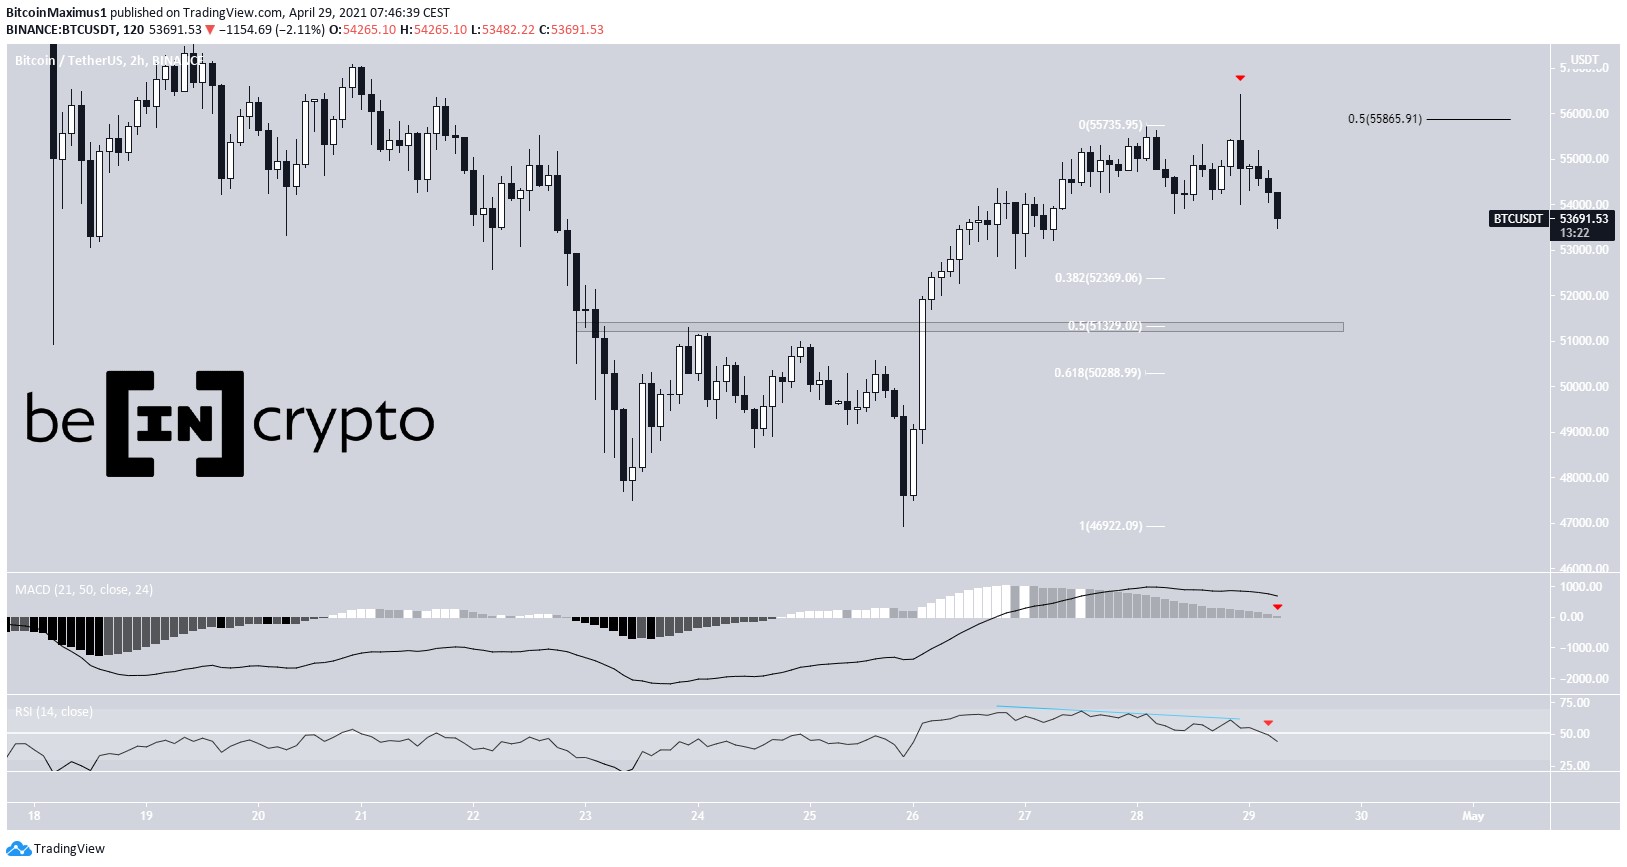
Chart By TradingView XRPXRP has been increasing since July 20. On Aug. 13, it managed to break out above the $1.05 horizontal area. Afterwards, it returned and validated the area as support.
The XRP movement seems similar to that of ETH, with the exception that XRP is still in wave four, which has taken the shape of a symmetrical triangle.
A potential target for the top of the upward movement is at $1.65. The target is found using the 0.618 length of waves 1-3 and coincides with a horizontal resistance area.
Chart By TradingView LUNALUNA has been moving upwards since July 20. On Aug. 1, it broke out from a descending resistance line and proceeded to reach a new all-time high price of $36.89 on Aug. 29.
The high was combined with bearish divergence in the RSI. Furthermore, it was reached right at the 1.61 external Fib retracement resistance level.
LUNA has been decreasing since and is attempting to hold on above the $30.50 horizontal support area.
Chart By TradingView DOTDOT has been moving upwards since July 20 in what resembles a parabolic upward movement. On Aug. 21, it was rejected by the $29 horizontal resistance area.
However, after a slight drop, it managed to break out amidst a bullish engulfing candlestick on Aug. 31. The breakout transpired with considerable volume.
While there is a potential bearish divergence in the RSI, both it and the MACD are moving upwards.
The next closest resistance is at $41.
Chart By TradingView UNIUNI has been increasing since reaching a low of $14.01 on July 21.
On Aug. 11, it initially moved above the $19 resistance level, but fell right below it afterwards. At the time, this seemed like a deviation (red circle) that is followed by a downward movement.
However, UNI began another upward movement and broke out on Aug. 30.
In addition to this, both the MACD and RSI are turning bullish. The former has generated several higher momentum bars while the latter is above 50.
The next closest resistance is at $40.
Chart By TradingView ANKRANKR had been decreasing inside a descending parallel channel since March 28.
However, it bounced on June 22 and has been moving upwards since.
On Aug. 14, ANKR managed to break out from the channel. However, it has not initiated a significant upward movement yet.
Despite the lack of an upward movement, the RSI has generated considerable hidden bullish divergence, a sign of trend continuation.
The closest resistance area is at $0.152.
Chart By TradingViewFor BeInCrypto’s latest Bitcoin (BTC) analysis, click here.
The post BTC, ETH, XRP, LUNA, DOT, UNI, ANKR – Technical Analysis Sept. 1 appeared first on BeInCrypto.
origin »Bitcoin price in Telegram @btc_price_every_hour
Bitcoin (BTC) на Currencies.ru
|
|