2021-4-30 15:06 |
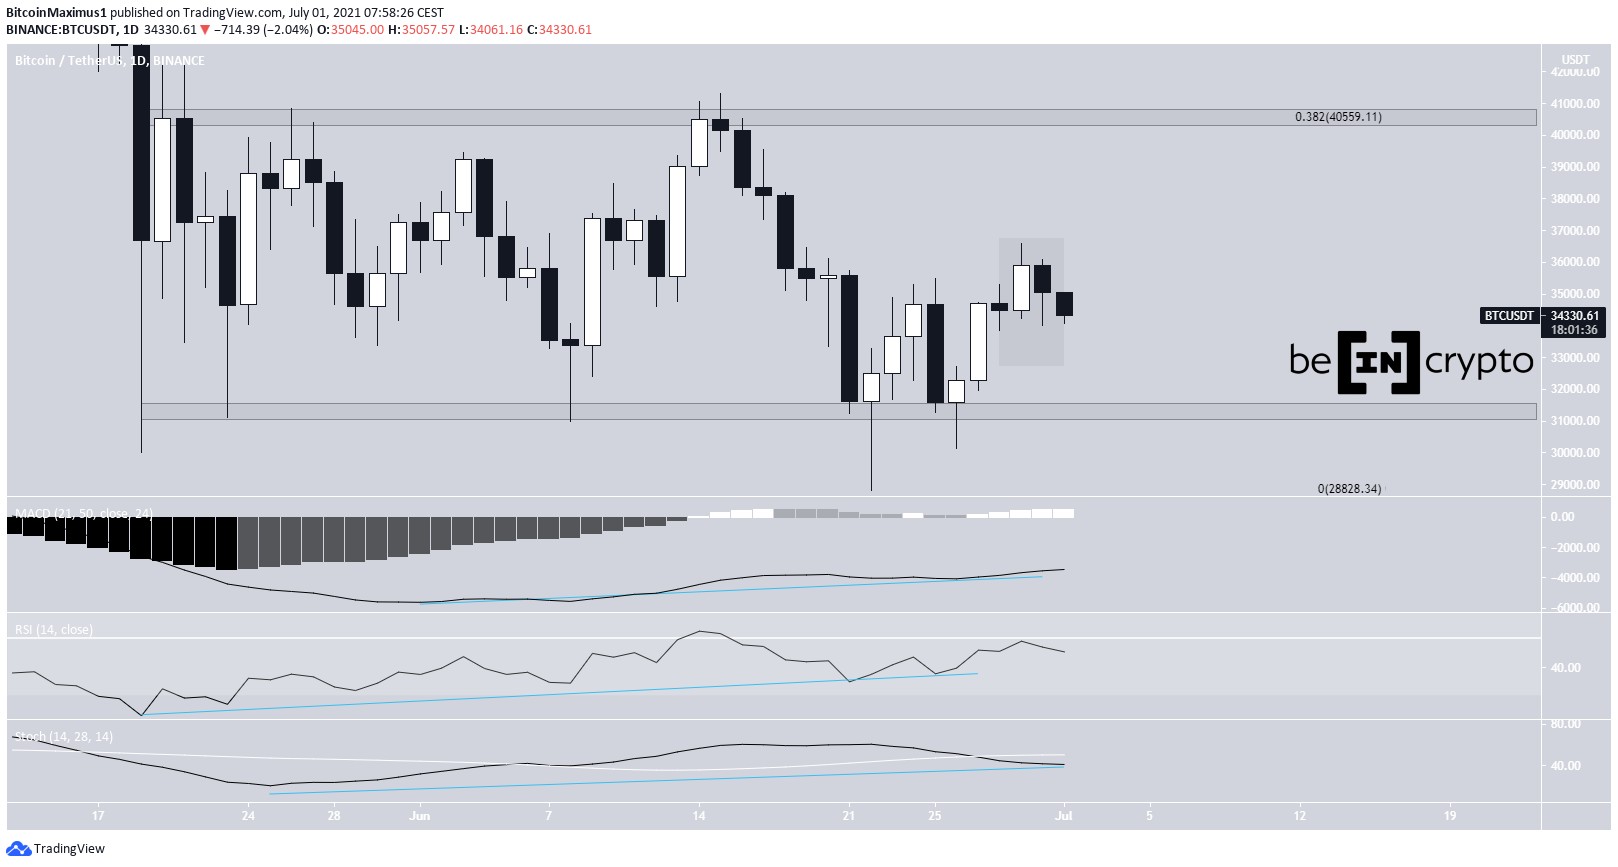
The bitcoin (BTC) price has been decreasing since it was rejected by the $55,850 resistance area.
Ethereum (ETH) reached a new all-time high on April 28.
XRP (XRP) has been increasing since it started to recover on April 23.
Swipe (SXP) has broken out from a descending resistance line while Fantom (FTM) has broken out from a descending wedge.
Verge (XVG) was rejected by a long-term resistance level.
ICON (ICX) has completed a running flat correction.
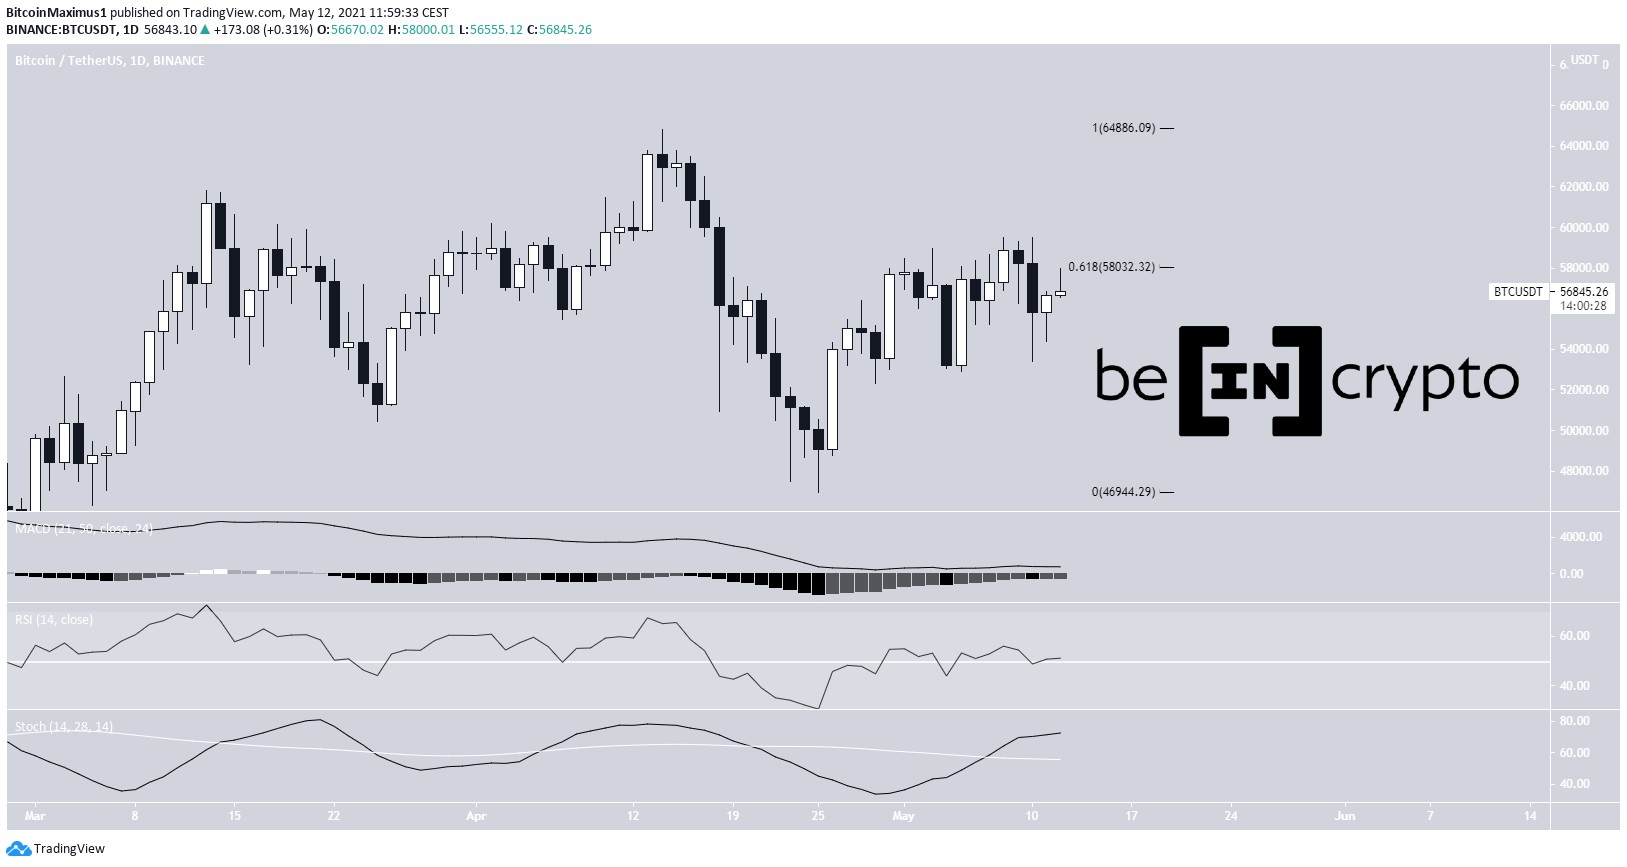
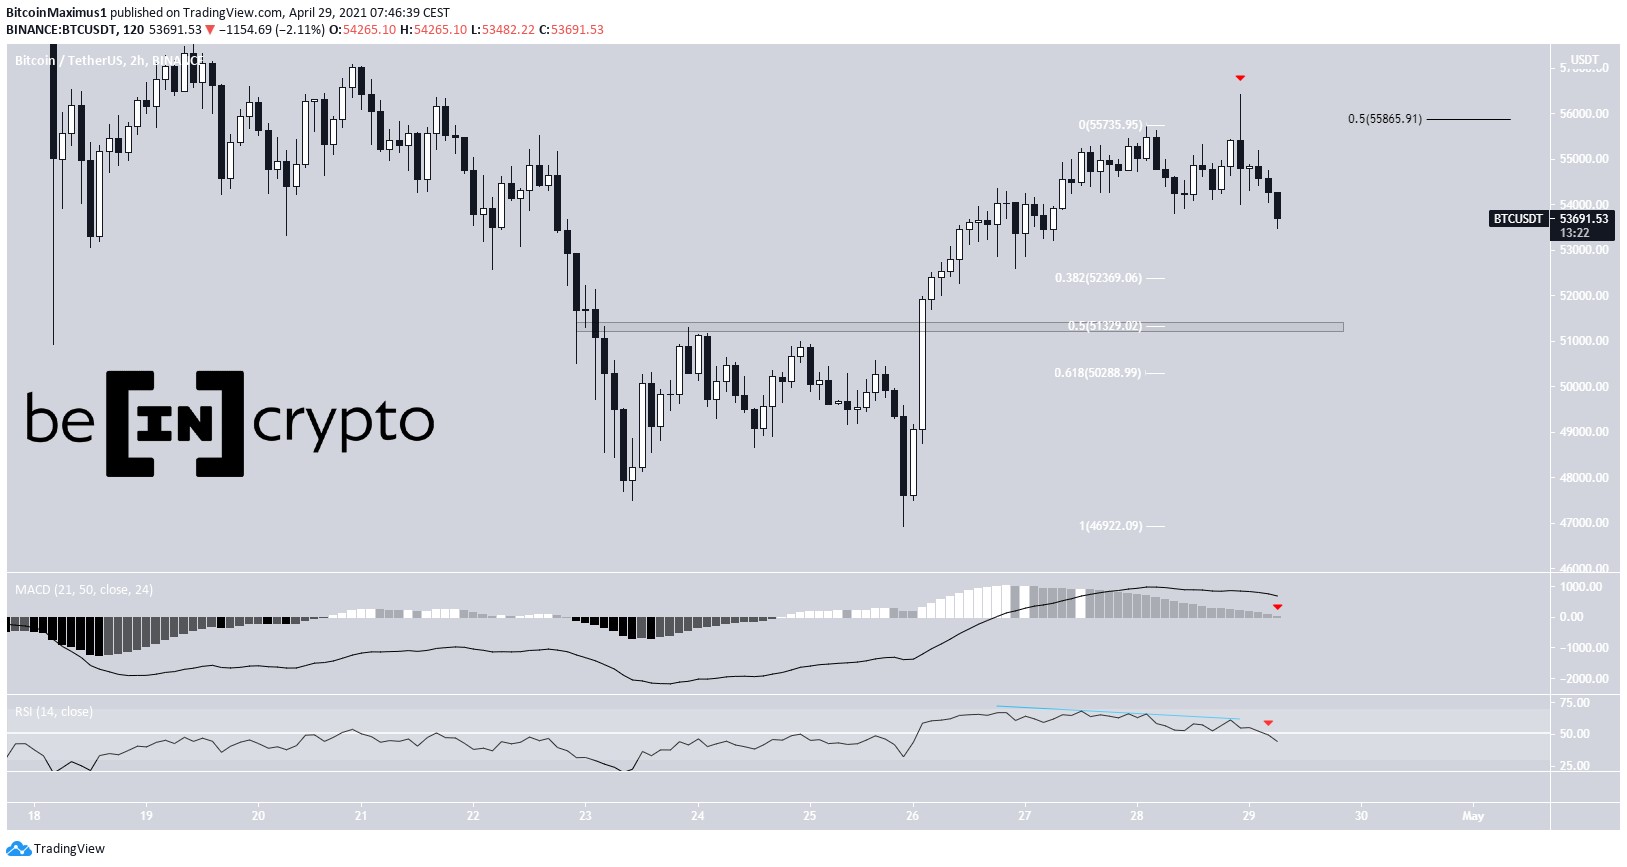
BTCOn April 28, BTC reached a high of $56,428 before decreasing. The high was made at the 0.5 Fib retracement resistance level (black) measuring the previous decrease.
The RSI has generated a bearish divergence and the MACD has almost crossed below 0. Both of these are signs that a correction is expected.
There are support levels at $52,370, $51,330 and $50,300. The $51,330 area is also a horizontal support level, increasing its significance.
BTC Chart By TradingView ETHOn April 28, ETH reached a new all-time high of $2760. It has decreased slightly since.
The wave count suggests that it’s in sub-wave three (red) of wave five (black). The most likely targets for the top of the upward movement are found at $2,874 and $3,351. Since the price is already close to the former at a time when there is another sub-wave left, it’s likely that ETH will reach the higher target.
These targets were found using a Fib projection on waves 1-3.
For a longer-term analysis, click here.
Chart By TradingView XRPXRP has been moving downwards since April 14, when it completed wave three (orange), reaching a high of $1.94.
The decrease continued until April 23, when XRP reached a low of $0.88. This completed a fourth wave pullback. The token reclaimed the 0.618 Fib retracement support shortly afterward.
The most likely target for the top of the upward movement is located at $2.69. This increase would complete wave five. This target was also found using a Fib projection on waves 1-3.
XRP Chart By TradingView SXPSXP has been decreasing alongside a descending resistance line since it reached a high of $5.50 on April 10.
After three unsuccessful attempts, it finally managed to break out above this line on April 29. So far, it has reached a local high of $4.88.
If the price returns to retest the breakout level, the $4.20 area is likely to act as support. Conversely, the $5.10 area is expected to provide resistance.
For a long-term analysis, click here.
SXP Chart By TradingView XVGXVG increased considerably in the second week of April, reaching a high of $0.08 on April 17. However, it was rejected by the 0.618 Fib retracement level immediately afterward.
It created a bearish engulfing candlestick the next week. It has yet to retest the previous breakout level at $0.028 and validate it as support.
Consolidation between these two levels is expected before XVG can eventually break out and move towards $0.11.
XVG Chart By TradingView Fantom (FTM)On March 28, FTM broke out from a descending wedge. Afterward, it dropped once more but completed a double bottom pattern on April 23. It has been moving upwards since.
Currently, it’s in the process of reclaiming the $0.66 resistance area. If successful in reaching a close above it, FTM is likely to increase towards $0.90 and potentially a new all-time high price.
FTM Chart By TradingView ICXICX has been moving upwards since bouncing on April 23. The low of $1.48 occurred right at the support line of an ascending parallel channel, potentially completing a running flat correction.
A likely target for the top of the upward movement is found at $4.06.
Similar to ETH, the target is found using a Fib projection on waves 1-3.
ICX Chart By TradingViewFor BeInCrypto’s latest bitcoin (BTC) analysis, click here.
The post BTC, ETH, XRP, SXP, XVG, FTM, ICX—Technical Analysis April 29 appeared first on BeInCrypto.
origin »Bitcoin price in Telegram @btc_price_every_hour
Bitcoin (BTC) на Currencies.ru
|
|