2021-9-28 13:06 |
Bitcoin (BTC) was rejected by the $44,000 horizontal resistance area.
Ethereum (ETH) is following a descending resistance line and potentially trading inside a descending wedge.
XRP (XRP) is following a descending support line.
Horizen (ZEN) has broken down from an ascending support line.
Uniswap (UNI) has broken out from a descending wedge.
OMG Network (OMG) is following an ascending support line.
Axie Infinity (AXS) has broken out from a descending resistance line.
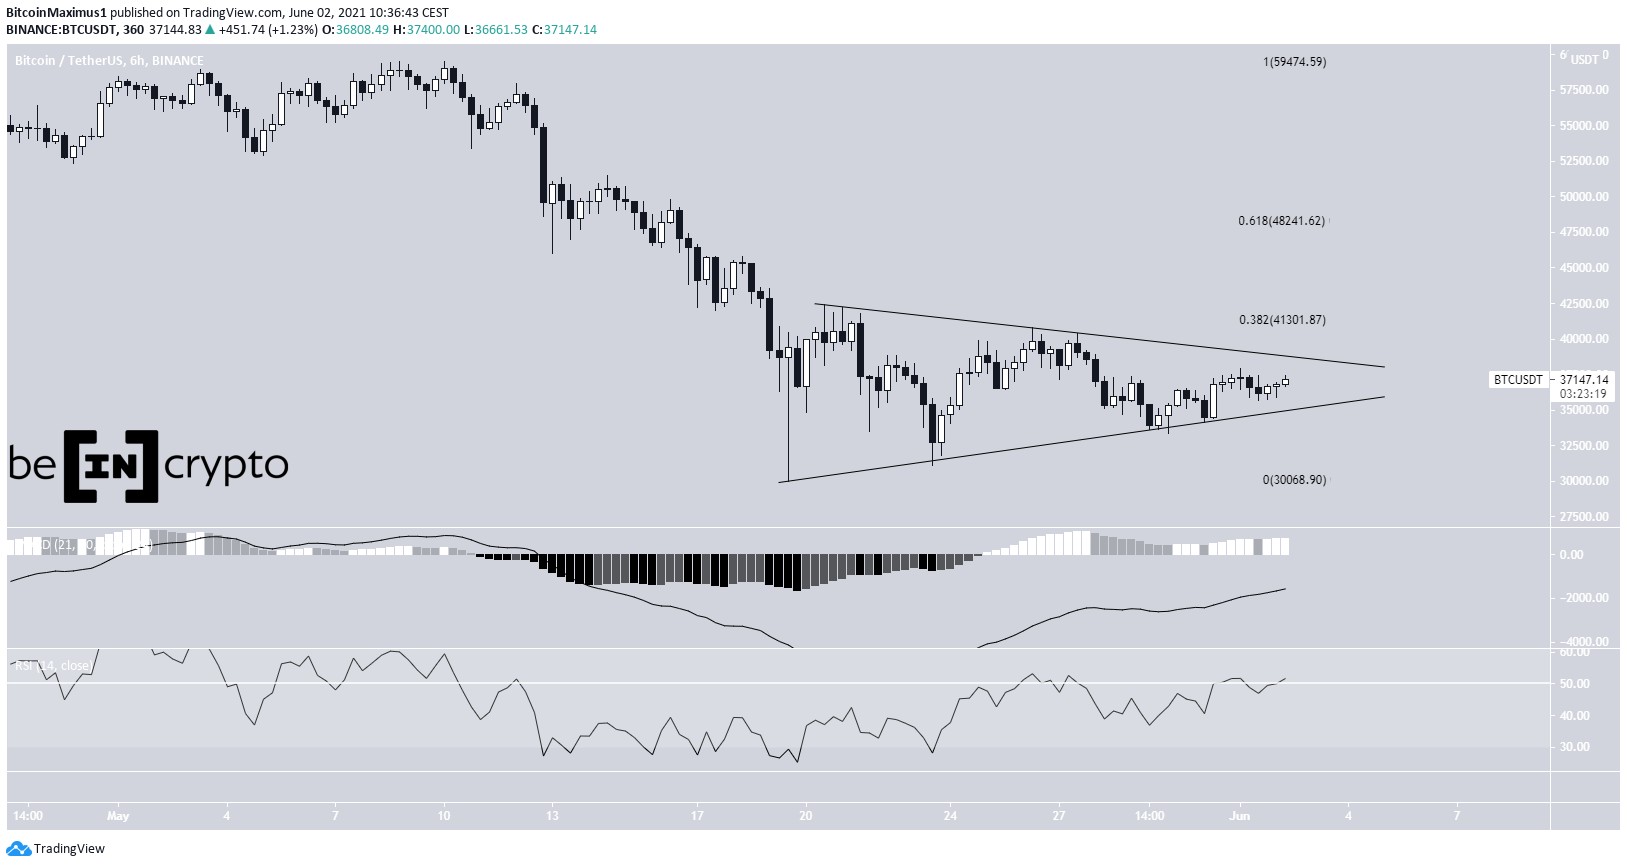
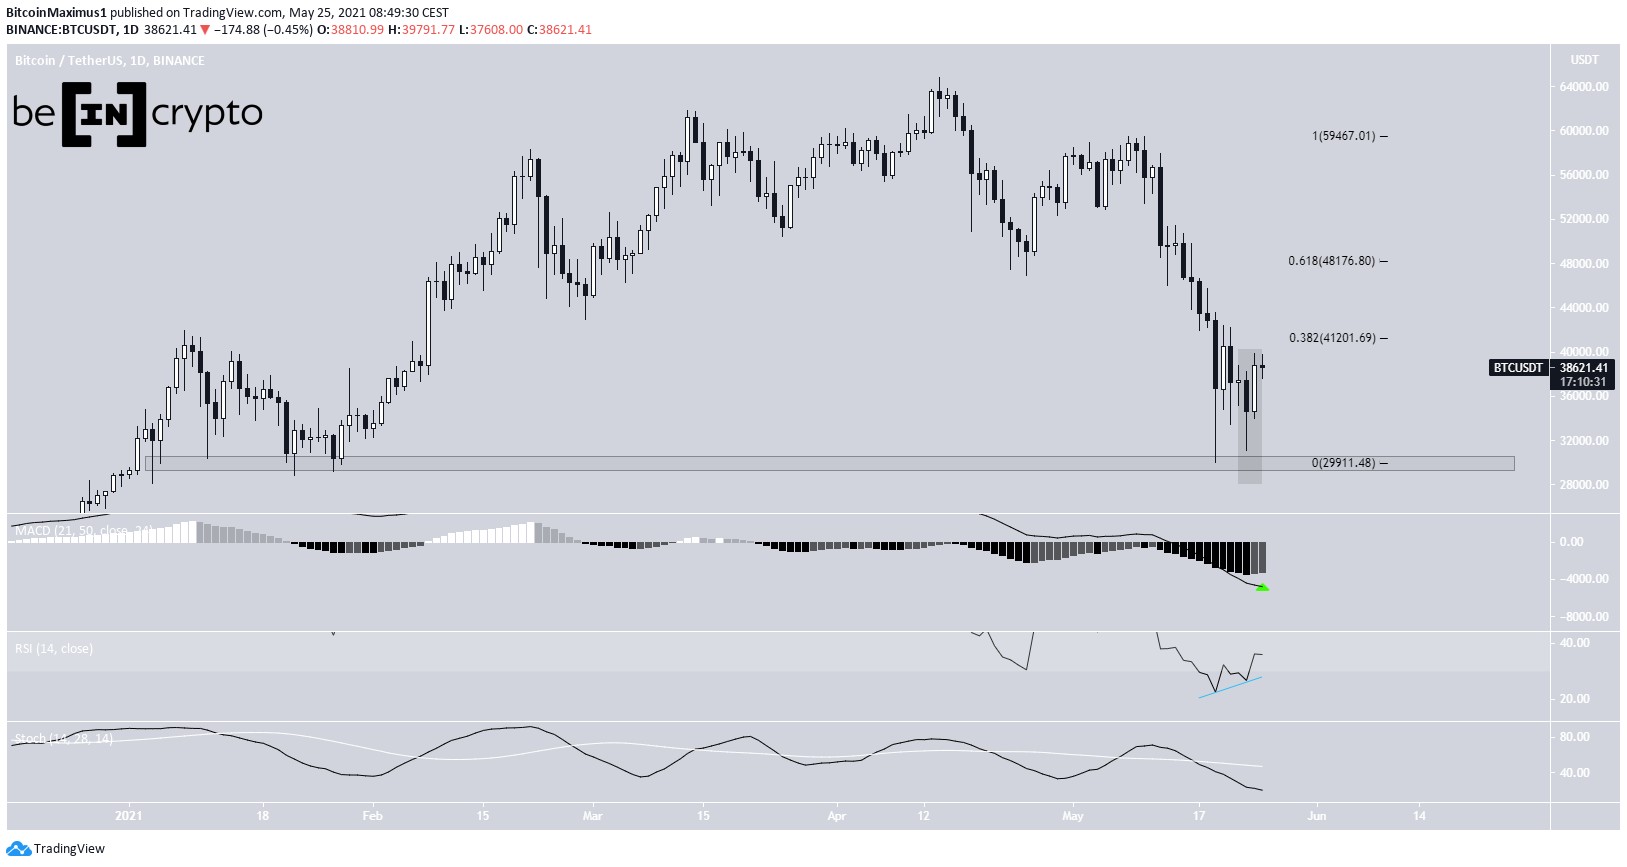
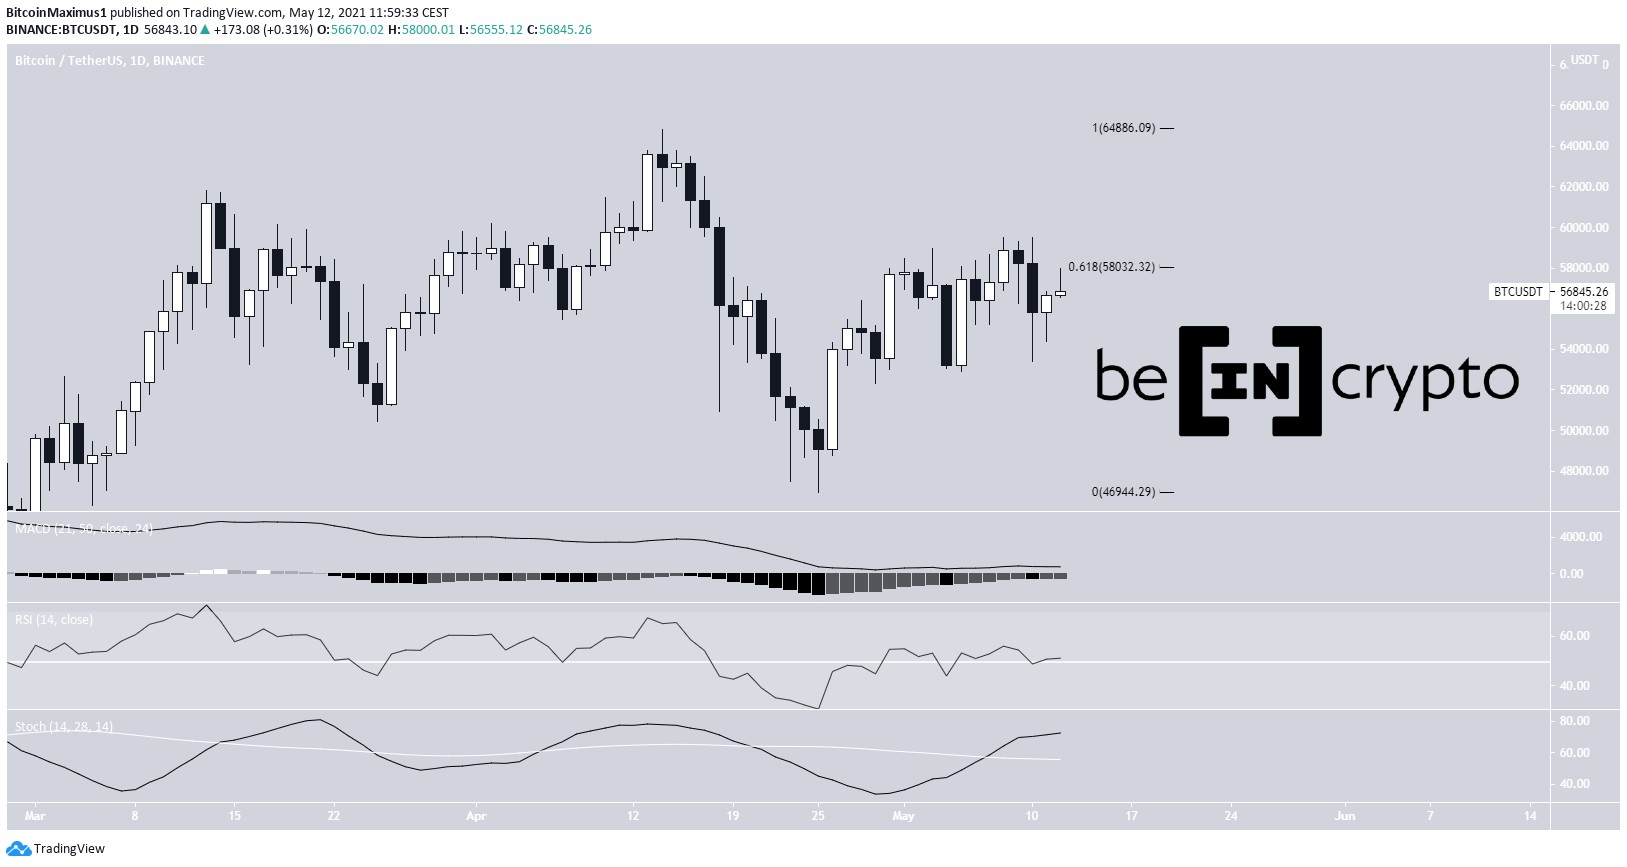
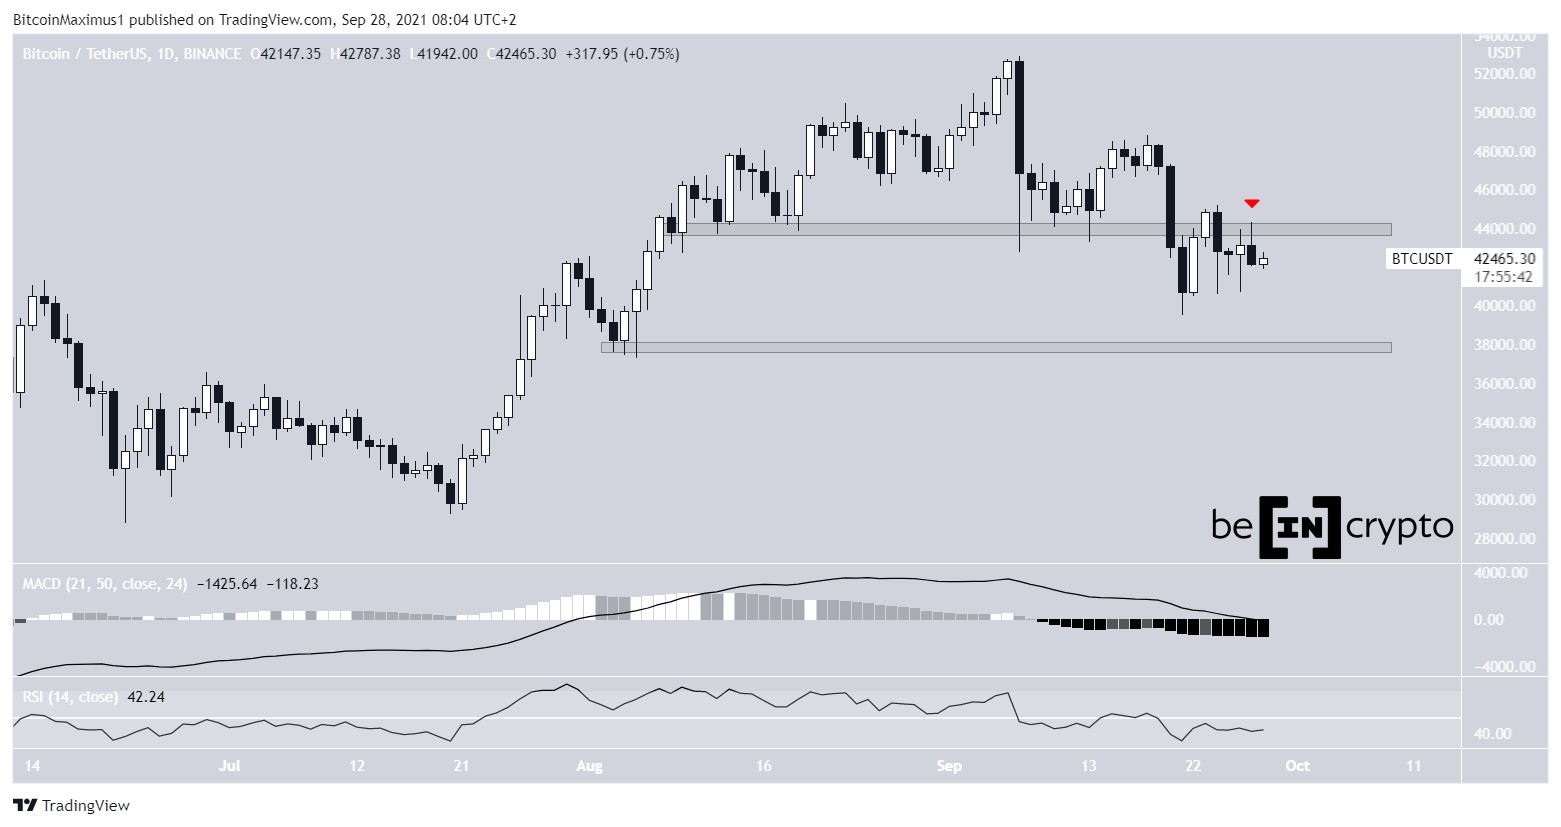
BTCOn Sept 27, BTC was rejected by the $44,000 resistance area and created a long upper wick (red icon). This is a bearish sign since the area had previously been acting as support, and the rejection now validates it as resistance.
Technical indicators in the daily time frame are bearish. Both the RSI and MACD are decreasing. The former is negative while the latter has just fallen below 50.
The next closest support area is found at $38,000.
BTC Chart By TradingView ETHETH has been decreasing underneath a descending resistance line since Sept 3. Most recently, it was rejected by the line on Sept 16.
Due to the long lower wicks, the support line cannot be accurately determined. However, it’s possible that ETH is trading inside a descending wedge.
Despite the wedge normally being considered a bullish pattern, technical indicators are neutral. The RSI is right at the 50-line and the MACD is below 0, although it is increasing.
Therefore, the direction of the trend cannot be accurately determined at the current time.
ETH Chart By TradingView XRPXRP has been following a descending support line since Aug 17. So far, it has been validated multiple times, most recently on Sept 21. The final touch of the support line (green icon) also coincided with the 0.618 Fib retracement support level at $0.85.
Despite the fact that XRP is trading above a confluence of support levels, technical indicators are not bullish. The RSI is at the 50-line and the MACD is negative, even though it is moving upwards.
The closest support and resistance levels are found at $0.76 and $1.07 respectively.
XRP Chart By TradingView ZENZEN has been decreasing since Sept 15, after creating a double top pattern and a long upper wick. The pattern was also combined with a bearish divergence in the RSI.
Shortly after, it broke down from an ascending support line. The breakdown is supported by the MACD and RSI, which are both decreasing.
The closest support area is found at $53.
ZEN Chart By TradingView UNIUNI has been decreasing since Sept 2. After the Sept 7 drop, it created a descending wedge, which led to a low of $17.73 on Sept 26.
However, UNI rebounded and broke out from the wedge. The breakout is supported by the increasing MACD and RSI.
The closest resistance area is found at $26.15, created by the 0.618 Fib retracement resistance levels.
If UNI is successful in moving above it, it may move toward new highs.
UNI Chart By TradingView OMGOMG has been following an ascending support line since July 20. However, since Sept 6, it has failed to break out above the $10.60 area, which is the 0.618 Fib retracement resistance level.
Despite the rejection, technical indicators are bullish. The RSI has generated a hidden bullish divergence and the MACD is positive.
Therefore, an eventual breakout would be likely. This could take OMG toward the $15.33 all-time high price.
OMG Chart By TradingView AXSAXS has been increasing since Sept 21 when it bounced at the $48.28 support area. The next day, it created a bullish engulfing candlestick and broke out from a descending resistance line.
Following this, it reclaimed the $63 horizontal area and validated it as support.
Both the MACD and RSI are increasing, supporting the continuation of the upward movement.
The next resistance area is found at the all-time highs of $94.50.
AXS Chart By TradingViewFor BeInCrypto’s latest Bitcoin (BTC) analysis, click here.
The post BTC, ETH, XRP, ZEN, UNI, OMG, AXS — Technical Analysis Sept 28 appeared first on BeInCrypto.
origin »Bitcoin price in Telegram @btc_price_every_hour
Bitcoin (BTC) на Currencies.ru
|
|