2021-6-2 13:57 |
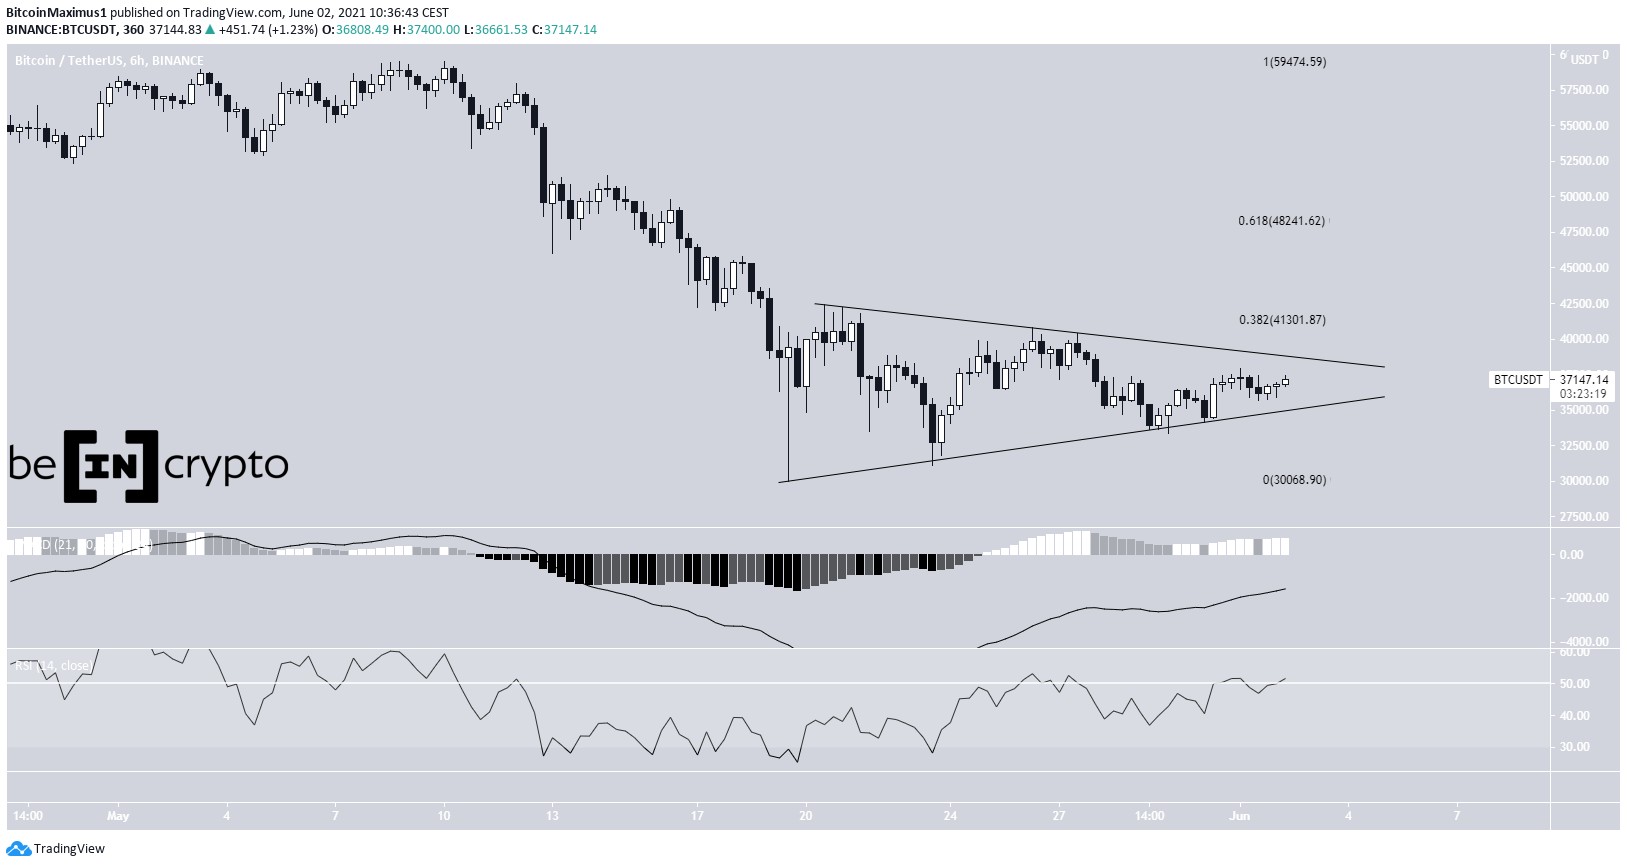
Bitcoin (BTC) is trading inside a short-term symmetrical triangle.
Ethereum (ETH) and Dogecoin (DOGE) have broken out from descending resistance lines.
XRP (XRP) is attempting to break out above the $1.05 resistance area.
0x (ZRX) is facing resistance at $1.28.
Horizen (ZEN) and Decred (DCR) are following descending resistance lines.
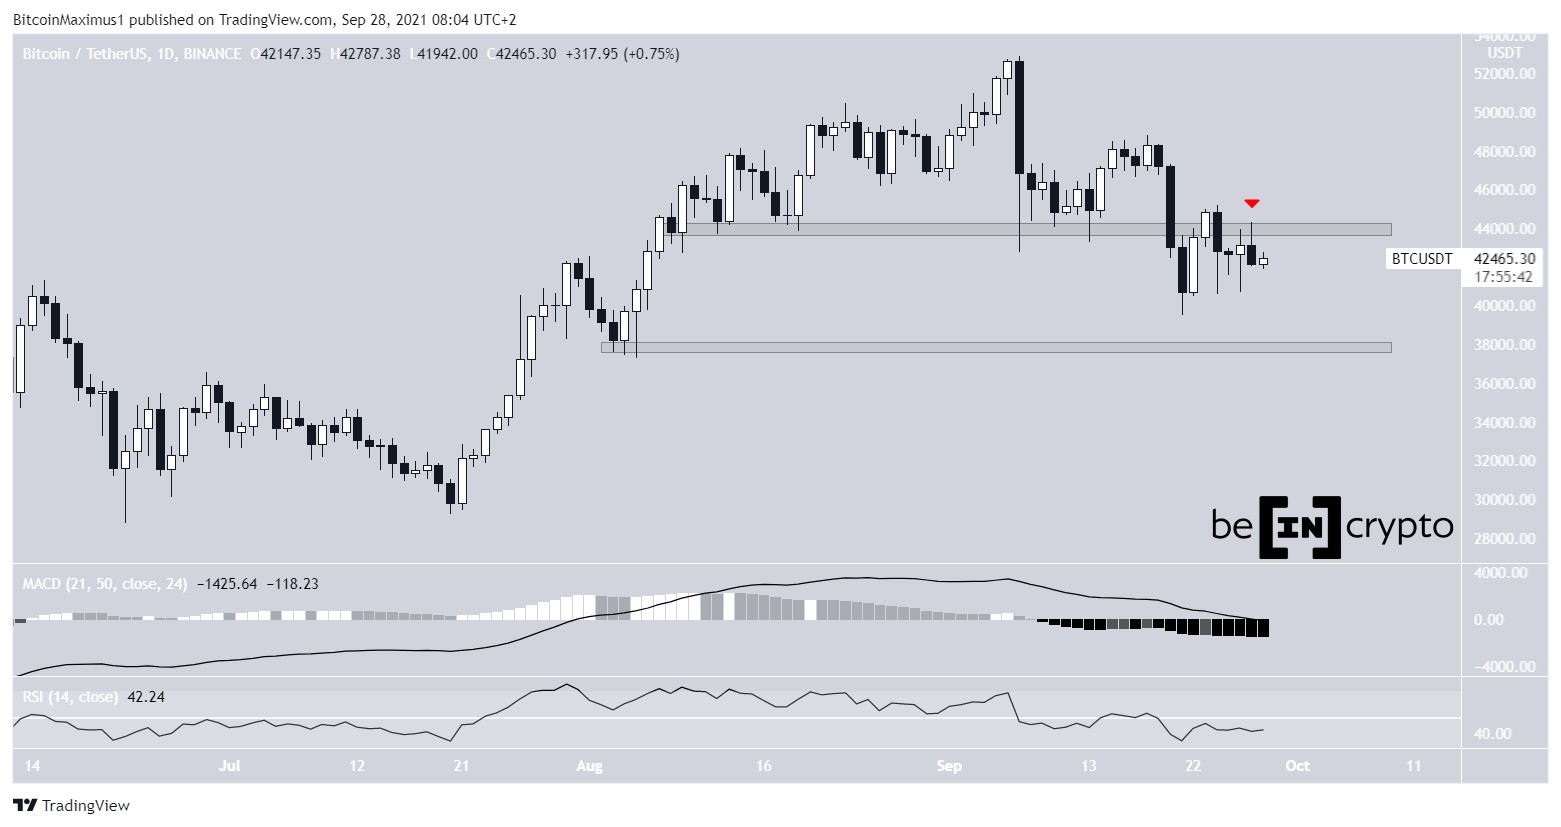
BTCBTC has been trading inside a short-term symmetrical triangle since May 19. This triangle pattern is normally considered a neutral formation.
The main resistance levels are found at $41,200 and $48,200.
Technical indicators are leaning on bullish, suggesting that a breakout would be more likely than a breakdown.
For a more in-depth analysis, click here.
BTC Chart By TradingView ETHOn May 30, ETH broke out from a descending resistance line that had been in place since May 12. It’s been moving upwards since the breakout, approaching the main resistance area which is found at $2,850.
The upward movement is supported by both the MACD and RSI. The latter has crossed above 50 while the former is close to moving above the 0-line.
If ETH is successful in reclaiming $2,850, the next closest resistance would be found at $3,370.
ETH Chart By TradingView XRPXRP has been decreasing inside a descending parallel channel since April 14. On May 23, it bounced after reaching the support line (green icon).
Currently, it’s in the process of making a third breakout attempt above $1.05. This is both the 0.382 Fib retracement resistance level and a horizontal resistance area.
A breakout above could trigger a sharp upward movement towards the resistance line of the channel at $1.46.
The MACD and RSI support the possibility of a breakout. The latter has crossed above 50 while the former is close to moving above the 0-line.
XRP Chart By TradingView DOGEDOGE began to decrease alongside a descending resistance line on May 8. However, it reached a local low of $0.211 on May 19 and has been moving upwards since.
On May 25, it broke out over the descending resistance line. It returned to validate it as support a few days later and has now begun another upward movement, approaching the next resistance at $0.43.
Technical indicators are bullish. The MACD has given a bullish reversal signal, the RSI is in the process of moving above 50, and the Stochastic oscillator has nearly made a bullish cross.
Therefore, DOGE is expected to reach the $0.43 area and potentially break out.
DOGE Chart By TradingView ZRXZRX has been increasing since rebounding on May 24. So far, it’s managed to create a higher low on May 30.
Technical indicators support the increase. This is especially evident by the bullish reversal in the MACD and the impending bullish cross in the Stochastic oscillator (green circle).
However, there is a crucial resistance area found at $1.28. Until ZRX manages to clear it, the trend cannot be considered bullish.
ZRX Chart By TradingView ZENZEN has been decreasing alongside a descending resistance line since May 8. At the time, it had just reached an all-time high price of $169.23.
It continued decreasing until May 19, when it reached a low of $53.33.
Currently, it’s in the process of breaking out from the resistance line. If successful, there would likely be resistance at $125.
Technical indicators support the possibility of a breakout. The MACD has given a bullish reversal signal and is above 0, the RSI has crossed above 50, and the Stochastic oscillator has just made a bullish cross (green icon).
Therefore, ZEN is expected to eventually break out.
ZEN Chart By TradingView DCRSimilar to ZEN, DCR has been decreasing alongside a descending resistance line since reaching an all-time high price of $250 on April 16. It created a lower high on May 10 and continued to move downwards.
The recent increase above the $164 low (red line) indicates that this is likely a correction and not and not a bearish impulse.
Technical indicators support the continuation of the upward movement. This is especially evident by the RSI cross above 50 and the bullish cross in the Stochastic oscillator (green icons).
Therefore, DCR is expected to reach the descending resistance line at $190 and potentially break out above it.
DCR Chart By TradingViewFor BeInCrypto’s previous bitcoin (BTC) analysis, click here.
The post BTC, ETH, XRP, DOGE, ZRX, ZEN, DCR—Technical Analysis June 2 appeared first on BeInCrypto.
origin »Bitcoin price in Telegram @btc_price_every_hour
Bitcoin (BTC) на Currencies.ru
|
|