Bitcoin (BTC) on-Chain Analysis: Mining Indicators Give Bottoming Signals

2022-8-24 19:30

Be[in]Crypto takes a look at Bitcoin (BTC) on-chain indicators that relate to miners, more specifically, the difficulty ribbon compression and the Market Cap to Thermocap Ratio
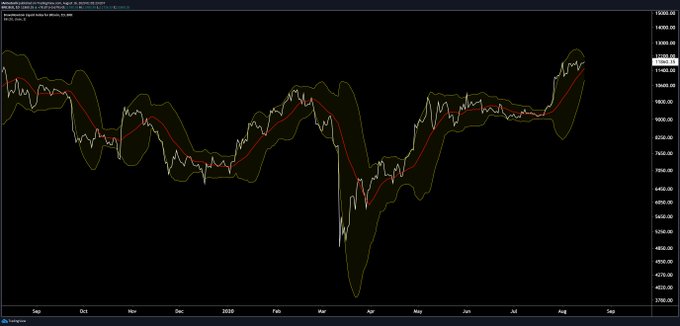
Difficulty ribbon compressions

The difficulty ribbon is an on-chain indicator which uses moving averages (MA) of the Bitcoin mining difficulty. Next, the difficulty ribbon compression adds a standard deviation in order to better determine if the market is close to bottoming. 

Historically, values between 0.01 and 0.02 have been associated with bottoms.

In 2022, the indicator crossed into oversold territory (<0.05) in May and is currently at 0.0153 (red circle) The only other time it as lower than this was in Jan 2021 at 0.0137.

However, all three previous market cycle bottoms (black circles) were reached at higher values.

More specifically, the 2015 bottom was reached at 0.024, the 2018 bottom was reached at 0.019 and the 2020 one at 0.020.

So, the difficulty ribbon compression indicator suggests that BTC is close to a bottom. This reading is also in line with other mining indicators such as the Puell Multiple and the Hash Ribbon.

Chart By GlassnodeBTC BTC market cap to Thermocap ratio

The Thermocap is the aggregated amount of coins that are paid to miners. It serves as a proxy to how much mining resources are spent. The Market Cap to Thermocap Ratio is created by dividing the market cap by the thermocap.  It is used to determine if the price is oversold or overbought relative to the total security spend by miners. 

Indicator values below 0.0000004 are considered oversold. Historically, every bottom has been reached below this level (red circle). Currently, the indicator is giving a reading of 0.00000056, which is above this oversold area. 

However, it is possible to draw an ascending support line that connects the previous bottoms. In this case, the indicator has bounced at this support line once more. This alternate reading supports the possibility that a bottom has been reached. 

If correct, the indicator will bounce at this support line and reverse its current bearish trend. 

Chart By Glassnode

For Be[in]Crypto’s latest Bitcoin (BTC) analysis, click here

The post Bitcoin (BTC) on-Chain Analysis: Mining Indicators Give Bottoming Signals appeared first on BeInCrypto.

Similar to Notcoin - TapSwap on Solana Airdrops In 2024

origin »

Bitcoin (BTC) на Currencies.ru

$ 66353.89 (-0.45%)
Объем 24H $17.85b
Изменеия 24h: -0.74 %, 7d: 8.21 %
Cегодня L: $66326.95 - H: $67668.16
Капитализация $1307.209b Rank 1
Цена в час новости $ 21576 (207.54%)

indicators bitcoin btc on-chain signals bottoming give

indicators bitcoin → Результатов: 126


Фото:

Strong Technical Indicators Help Bitcoin Shoot Through $12,000, What Lies Ahead?

The bitcoin price, on Aug 17, soared above $12,000 to new 2020 highs coinciding with similar gains posted by the US equities following a depressing Q2 pinned to the slowing effects of COVID-19. Bitcoin Prices Rally at The Back of Supportive Technical Indicators A Bloomberg report shows that at yesterday’s peak, the Bitcoin price rose to $12,473Read MoreRead More.

2020-8-18 17:00


Фото:

Analyst: Bitcoin Likely to See a “Monster Breakout” in the Next 3 Days

Bitcoin’s historically low volatility coupled with limited liquidity and trading volume are creating the perfect storm for it to post a massive movement Multiple technical indicators are confirming that this sideways trading is likely to end in the near-term, including the crypto’s Bollinger Bands, which are currently the tightest they have been since November of 2018 One analyst is now noting that he anticipates Bitcoin to see a “monster breakout” in the next three days […]

2020-7-21 02:00


Фото:

Bitcoin is Flashing Signs of Weakness as It Trades Below Crucial Level

After another failed breakout attempt, Bitcoin is once again hovering just above its crucial $9,200 support The entire crypto market is currently expressing some signs of weakness This weakness may be rooted in BTC’s decline beneath what one analyst is describing as a crucial level He notes that a daily close beneath $9,230 would make a compelling case that further downside is imminent This comes as multiple technical indicators all point to an imminent surge […]

2020-7-15 02:00


Bitcoin’s On-Chain Indicators Flash Buy Despite Price Stagnation

Despite Bitcoin’s current price stagnation, on-chain indicators favor the bulls, with most holders remaining unphased by market volatility. Bitcoin’s Ambiguous Technical Indicators The technical outlook for the flagship cryptocurrency remains... The post Bitcoin’s On-Chain Indicators Flash Buy Despite Price Stagnation appeared first on Crypto Briefing.

2020-6-20 21:57


4 Indicators Show Bitcoin Has a “High Chance” of Falling in Next 2 Weeks: Analyst

Bitcoin has mounted a strong recovery since the lows seen last week. The leading cryptocurrency traded as high as $9,750 on Saturday, over 13% higher than last weekend’s lows. Even still, there remain textbook technical indicators suggesting there is a “high chance” BTC sees a correction in the coming weeks. According to the analyst that...

2020-6-1 13:00