These On-Chain Indicators are Flashing Warning Signs for Bitcoin’s Strength

2020-6-17 02:00

Bitcoin’s on-chain indicators are flashing some signs of weakness despite the cryptocurrency’s sharp rebound from its recent lows.

BTC has been subjected to some heavy volatility over the past several days, plunging to lows of $8,900 yesterday before rebounding up to the mid-$9,000 region.

This price action has simply marked an extension of the multi-month bout of consolidation that it has been caught within throughout the past several weeks and months – struggling to garner decisive momentum in either direction.

Although it is showing signs of overt strength due to its recent rally to highs of $10,500, it is important to note that the cryptocurrency is flashing signs of technical weakness due to a few key factors.

It also has shown some signs of weakness from a technical perspective as well.

One trader is noting that he does not believe the momentum seen throughout the past day will be enough to negate its recent weakness, potentially signaling that a movement back down to the lower-$9,000 region is imminent.

Bitcoin Posts Sharp Rebound from Yesterday’s Lows, But Technical Weakness Remains

At the time of writing, Bitcoin is trading up just under 2% at its current price of $9,460. The cryptocurrency has been trading around this level throughout the past several weeks, struggling to break below $9,000 or above $10,000.

These two levels mark the lower and upper boundaries of a long-held trading range that BTC has been trading within over a multi-month period.

The macro-resistance that buyers need to surmount to shift the trend in their favor sits at $10,500. This level has sparked three firm rejections over the past six months, and a failure to shatter it could confirm the triple top formation that is currently in play.

It is important to note that the cryptocurrency still is plagued by some underlying technical weakness.

One trader noted in a recent tweet that he believes there is enough evidence to support the notion that this latest rebound has been a stop-run.

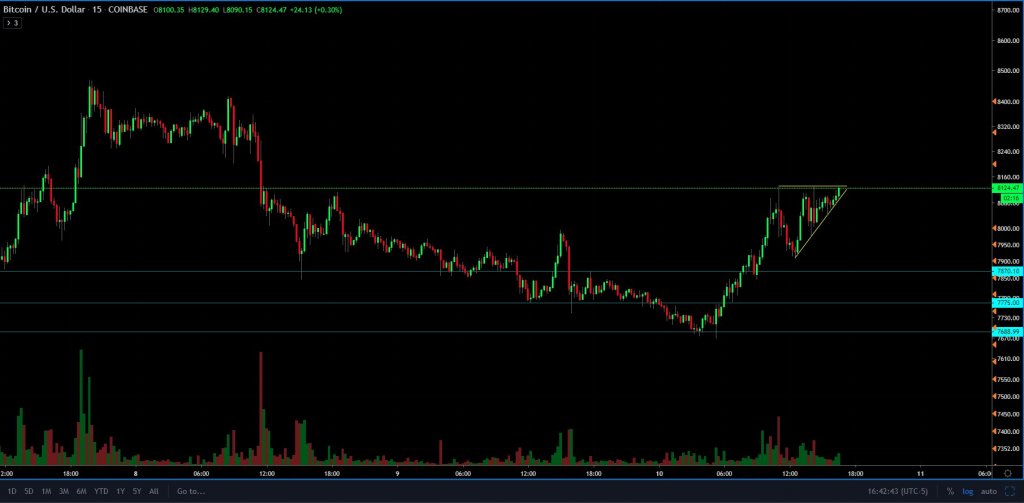
“BTC – I think there’s enough evidence to suggest that that was a run on a previous high that stopped me out. So I’m willing to try this trade again here,” he noted while pointing to the chart seen below, with a target in the lower-$9,000 region.

Image Courtesy of Calmly. Chart via TradingView These Three On-Chain Factors Point to Imminent BTC Downside

There are a few fundamental factors that suggest Bitcoin is poised to see some downwards momentum in the near-term.

Analytics platform IntoTheBlock spoke about these metrics in a recent tweet, explaining that three out of four of BTC’s momentum indicators are bearish.

“3 out of 4 On-chain indicators are showing a Bearish Momentum for Bitcoin… Why? 1)The number of addresses going to zero is higher than the number of new [addresses] created 2)The number of transactions greater than $100k is slowing down 3)The % of addresses in the money is decreasing,” they noted.

Data via IntoTheBlock Featured image from Shutterstock.

Similar to Notcoin - TapSwap on Solana Airdrops In 2024

origin »

Bitcoin (BTC) íà Currencies.ru

$ 66917.13 (-0.10%)
Îáúåì 24H $16.96b
Èçìåíåèÿ 24h: 0.15 %, 7d: 9.86 %
Cåãîäíÿ L: $66899.72 - H: $67006.39
Êàïèòàëèçàöèÿ $1318.265b Rank 1
Öåíà â ÷àñ íîâîñòè $ 9470.88 (606.56%)

lows signs bitcoin indicators on-chain flashing several

lows signs → Ðåçóëüòàòîâ: 53


Ôîòî:

XRP Has Been Setting Lower Highs for 886 Days; Why Analysts Expect More Weakness

XRP has been severely underperforming the aggregated crypto market throughout 2020 The crypto is now on its 886th day of selling lower lows Analysts do not believe that this trend is going to alleviate anytime soon, as there are other signs of weakness that it has been flashing in recent times One veteran trader even noted that it could soon plummet another 30% against its BTC trading pair XRP has been struggling to garner any […]

2020-6-13 23:00


Ôîòî:

Bitcoin Remains Poised to See Explosive Rally to $11,000 Despite Recent Plunge

After facing an intense influx of selling pressure yesterday, Bitcoin has been able to recover some of its recent losses as it navigates back into the mid-$9,000 region The cryptocurrency is showing some signs of strength due to the rebound seen from its overnight lows Analysts do not believe that this recent movement was enough to invalidate its macro strength, and some are still offering near-term targets as high as $11,000 In order for this […]

2020-6-13 21:00


Ôîòî:

Investors are Heavily Accumulating Ethereum Despite Gloomy Outlook

Ethereum has been seeing some incredibly lackluster price action throughout the past several weeks and months, setting a series of lower lows while losing ground against Bitcoin Despite showing signs of technical weakness, data shows retail investors have been busily accumulating the cryptocurrency This trend isn’t unique to just retail investors either, as data also reveals that institutional investors have also been stocking up on ETH Ethereum has seen some lackluster price action in recent […]

2020-5-25 22:00


Ôîòî:

Analysts Flip Short on Ethereum as Likelihood of a Sharp Decline Grows

Ethereum has begun finding immense stability within the $190 region following its recent dip to lows of $180 seen yesterday The cryptocurrency has been flashing some immense signs of weakness against its BTC trading pair throughout the past few weeks Multiple analysts are now noting that they anticipate ETH to decline further in the days and weeks ahead, potentially seeing losses that send it as low as $150 in the near-term Ethereum has seen a […]

2020-5-13 23:00


Ôîòî:

Here’s How Bitcoin Could Force Altcoins to Set “Major Lows”

Bitcoin has posted a notable upswing today that has allowed it to approach its next key resistance level at $9,500 The cryptocurrency’s intense uptrend is showing no signs of slowing down as it continues gaining dominance over the entire market Some analysts are now noting that altcoins could be positioned to see some serious losses in the weeks ahead as they all decline against their BTC trading pairs The aggregated cryptocurrency market has continued declining […]

2020-5-8 02:00


Ôîòî:

Ethereum Bulls in Serious Trouble as Fractal Forecasts Lower Lows

Ethereum saw a massive rejection from its overnight highs that led it to reel lower today, erasing part of the gains that were incurred during yesterday’s uptrend This has caused the crypto to flash signs of technical weakness, especially while looking towards its Bitcoin trading pair One analyst is also pointing to an extremely bearish XRP fractal pattern that ETH has been closely tracking as a potential reason why lower lows are imminent Ethereum incurred […]

2020-5-1 23:00


Ôîòî:

Ethereum Showing Signs of Tiredness as Analysts Expect Underperformance

Ethereum is in the process of surmounting the key $200 resistance level as its bullishness grows The cryptocurrency’s rebound from its March lows has been intense, although analysts are noting that a strong pullback could be in the cards This comes as traders note that they anticipate ETH to underperform Bitcoin in the days and weeks ahead Ethereum is now in the process of rallying up to $200, marking a significant extension of the momentum […]

2020-4-26 22:00


Litecoin is About to See Exponential Gains Because of This Pattern

Litecoin’s 2020 rally has begun to reach a fever pitch as the crypto shows signs of entering yet another upwards leg that allows LTC to set fresh year-to-date highs. Litecoin’s rally over the past several weeks has allowed it to put significant distance between its recent lows of $50 and its current price of just... The post appeared first on NewsBTC.

2020-2-2 01:00


Ôîòî:

Binance Coin Price Analysis: BNB Could Attempt Reversal To $26

Binance coin has created three lower lows between now and June as price action loses close to 50% of its value. Further downside is expected, however, signs of a reversal could be playing out. BNB/USD 1 Hour Analysis On the 1 hour chart for BNB/USDT, we can see at the end of August price levels crashed through $25 support as mentioned in my previous BNB analysis, since then price levels have bottomed around $21 and Read More The post Binance Coin Price Analysis: BNB Could Attempt Reversal To $26 appeared first on Bitcoinist.com.

2019-9-8 22:11


Ôîòî:

Bitcoin Price Analysis: Could Three Times Be the Charm for This Resistance Level?

Bitcoin remains in its tightly coiled range as the market continues its sideways trend for the third week in a row. While macro support has been tested three times recently, we have yet to test the overhanging macro resistance:Figure 1: BTC-USD, Daily Candles, Narrow RangeThe blue zone outlined above shows a very strong zone of support that, over the last few weeks, has seen three strong tests and has led to a slowly upward-drifting market consolidation.

2019-3-16 01:56


Ôîòî:

Bitcoin Price Analysis: Low Time Frames Show Signs of Life Amid Weekly Tests

Bitcoin continues to coil tightly within its range-bound market as the bulls and bears fight it out to see which is most dominant. On the lower time frames (TF), bitcoin is managing to find support:Figure 1: BTC-USD, 2-Hour Candles, Low TF SupportThe zone outlined by the green line in Figure 1 represents local support that has kept the market afloat for the last week and a half.

2019-3-13 22:26


Ôîòî:

Cryptocurrency Market ‘Vulnerable’ to Lower Lows, Says Fundstrat Strategist

Fundstrat Global Advisors strategist Robert Sluymer has warned that Bitcoin and the cryptocurrency market as a whole are displaying signs of vulnerability.   ‘Price Structure Remains Weak’ Robert Sluymer from Fundstrat Global Advisors has said in a note Wednesday, February 6th, that Bitcoin and most of the cryptocurrencies display signs of vulnerability, Bloomberg reports.

2019-2-7 21:00


Ôîòî:

Bitcoin Price Analysis: Strong Move Likely Following Tightly Coiled Market

Days and days of sideways consolidation and tightening volume has been the name of the game for the bitcoin market. A narrow range of $200 has caused a weeks worth of activity to coil and consolidate in preparation for bitcoin’s next move:Figure 1: BTC-USD, Daily Candles, Narrow RangeThe figure above shows just how narrow the range has been over the last week as the market has continued to grind out support and fail to break above overhanging resistance.

2019-1-26 03:13


Ether Price Analysis: Historic Support Tested Amid Signs of Distribution

It’s been weeks since ether has seen a new high or a new low and the market has found itself range-bound. At the moment, we are seeing signs of distribution as large rounds of selling have remained present during key support tests:Figure 1: ETHUSD, 4 Hour Candles, Trading RangeSo far, for the last few weeks, ether has seen a trend of higher lows and low highs (the converging red trendlines).

2018-10-20 01:31