Bitcoin (BTC) on-Chain Analysis: Lifespan Indicators Suggest Reversal Is Coming

2022-8-16 14:00

Be[In]Crypto takes a look at Bitcoin (BTC) on-chain indicators, specifically the Spent Output Profit Ratio (SOPR) and the RHODL Ratio.

BTC SOPR

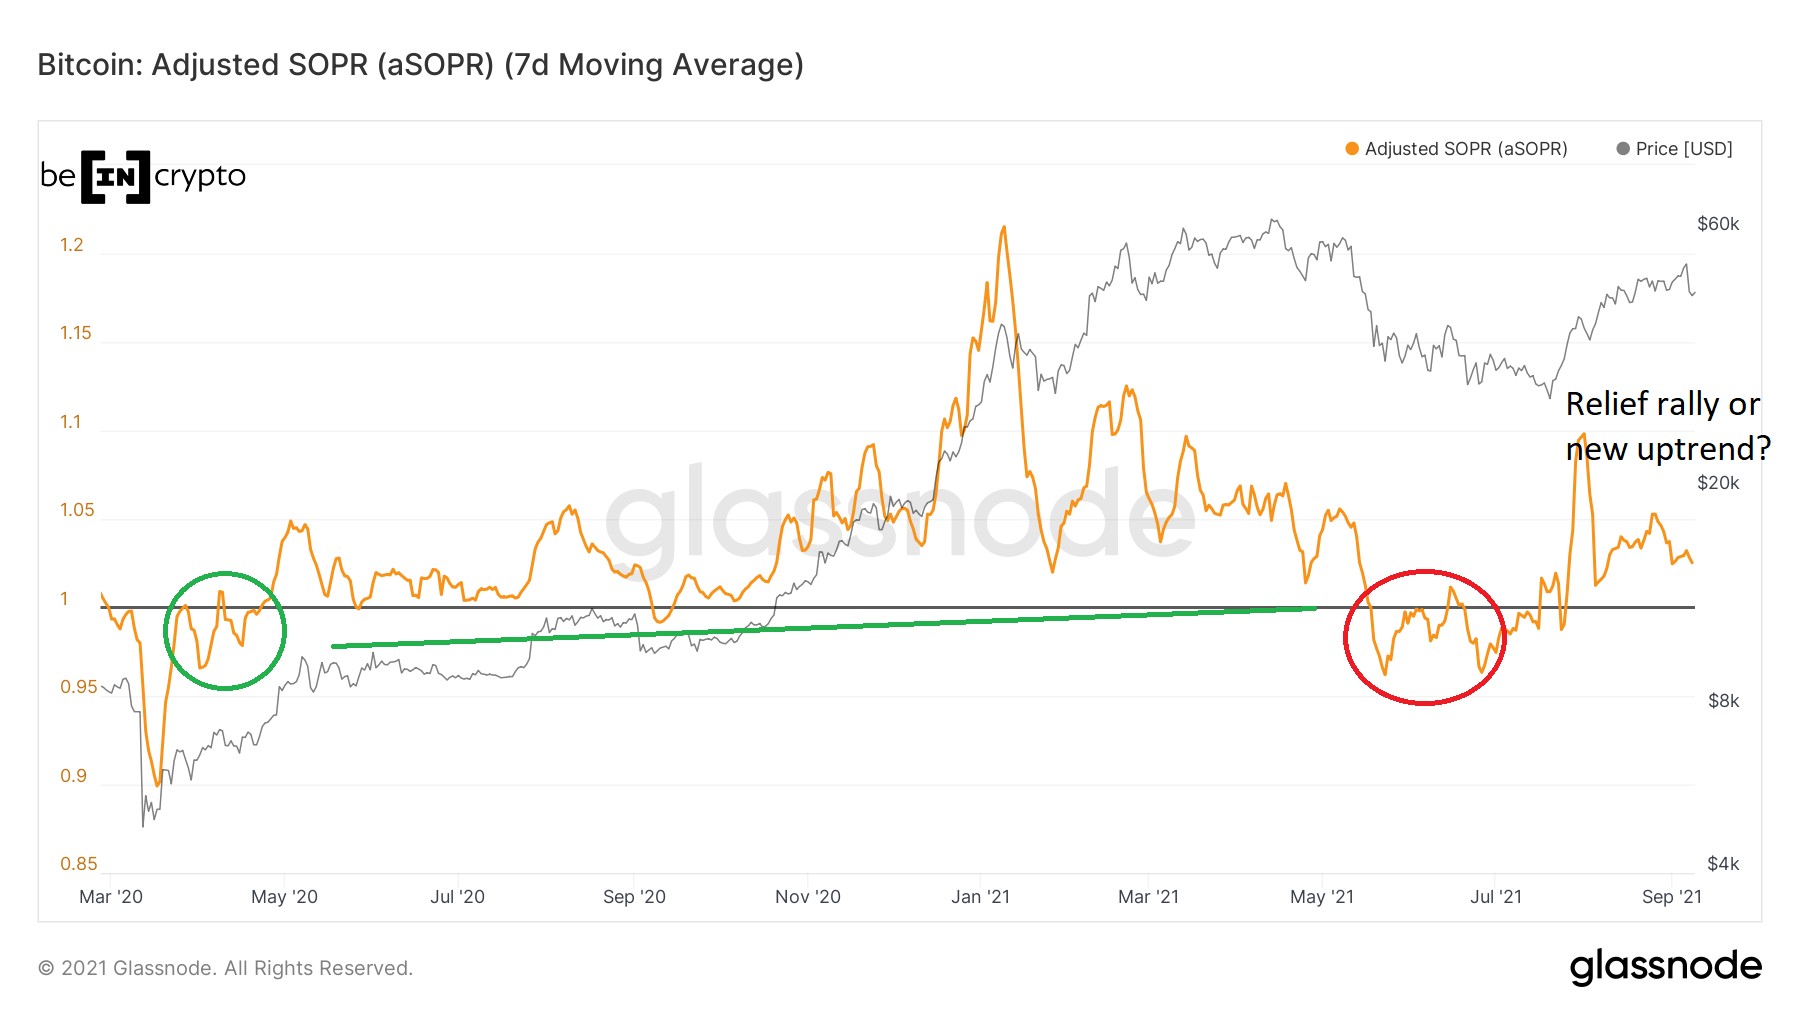
SOPR is an on-chain indicator that shows if the market is in a state of profit or loss. Readings above one (black line) show that the market is in aggregate profit, while those below one show aggregate loss. 

The main characteristic of bullish trends is that SOPR bounces at the one line instead of falling below it.

SOPR broke down below one (black circle) in Jan. 2018. This suggested that the bullish trend had come to an end.  Afterwards, the bottom was reached on Dec. 11 of the same year, at a reading of 0.86. The bottom was reached 11 months after the first breakdown.

In the current bull run, SOPR broke down below one in May 2021 (red circle). On June 18, it reached a value of 0.928. This is the third ever lowest value, being only higher than those on Dec 2018 and March 2020. The low was reached 13 months after SOPR first broke down below one. 

After the 2018 bottom, SOPR moved above one on April 5, 2019. This confirmed that the bottom is in. Currently, SOPR made an attempt at breaking out above the one line on Aug. 5 (red arrow). While the attempt was unsuccessful, the indicator is gearing up for another breakout attempt. 

If SOPR were to move above one, it would confirm that the bottom is in.

SOPR Chart By Glassnode RHODL Ratio

The RHODL ratio is an indicator that is created by the ratio between the one-week and the 1-2 year HODL Wave bands. Readings above 50,000 (highlighted in red) indicate that a significant percentage of the BTC supply is in the hands of short-term holders.

This reading is generally linked to tops, as was the case for the 2013 and 2017 peaks. However, this was not the case in the 2021 top, which was made at about 14,000. 

The RHODL ratio is currently at 360, which is slightly above the 350 ratio that is considered oversold. It is worth mentioning that the RHODL ratio dropped below 350 on Aug 11 before eventually moving above it.

Historically, decreases into oversold territory and subsequent increases above it have been a sign of market bottoms. 

Moreover, it is possible to draw an ascending support line connecting the 2015 and 2019 bottoms. If the line holds, it would suggest that the ratio has bounced at the line once more and confirmed the BTC market bottom.

RHODL Chart By Glassnode

For Be[in]Crypto’s latest Bitcoin (BTC) analysis, click here

The post Bitcoin (BTC) on-Chain Analysis: Lifespan Indicators Suggest Reversal Is Coming appeared first on BeInCrypto.

Similar to Notcoin - TapSwap on Solana Airdrops In 2024

origin »

Bitcoin (BTC) на Currencies.ru

$ 71359.6 (+0.14%)
Объем 24H $50.356b
Изменеия 24h: 7.01 %, 7d: 14.37 %
Cегодня L: $68995.48 - H: $71441.63
Капитализация $1405.867b Rank 1
Цена в час новости $ 23770.84 (200.2%)

indicators bitcoin btc on-chain ratio coming reversal

indicators bitcoin → Результатов: 126


Фото:

Strong Technical Indicators Help Bitcoin Shoot Through $12,000, What Lies Ahead?

The bitcoin price, on Aug 17, soared above $12,000 to new 2020 highs coinciding with similar gains posted by the US equities following a depressing Q2 pinned to the slowing effects of COVID-19. Bitcoin Prices Rally at The Back of Supportive Technical Indicators A Bloomberg report shows that at yesterday’s peak, the Bitcoin price rose to $12,473Read MoreRead More.

2020-8-18 17:00


Фото:

Analyst: Bitcoin Likely to See a “Monster Breakout” in the Next 3 Days

Bitcoin’s historically low volatility coupled with limited liquidity and trading volume are creating the perfect storm for it to post a massive movement Multiple technical indicators are confirming that this sideways trading is likely to end in the near-term, including the crypto’s Bollinger Bands, which are currently the tightest they have been since November of 2018 One analyst is now noting that he anticipates Bitcoin to see a “monster breakout” in the next three days […]

2020-7-21 02:00


Фото:

Bitcoin is Flashing Signs of Weakness as It Trades Below Crucial Level

After another failed breakout attempt, Bitcoin is once again hovering just above its crucial $9,200 support The entire crypto market is currently expressing some signs of weakness This weakness may be rooted in BTC’s decline beneath what one analyst is describing as a crucial level He notes that a daily close beneath $9,230 would make a compelling case that further downside is imminent This comes as multiple technical indicators all point to an imminent surge […]

2020-7-15 02:00


Bitcoin’s On-Chain Indicators Flash Buy Despite Price Stagnation

Despite Bitcoin’s current price stagnation, on-chain indicators favor the bulls, with most holders remaining unphased by market volatility. Bitcoin’s Ambiguous Technical Indicators The technical outlook for the flagship cryptocurrency remains... The post Bitcoin’s On-Chain Indicators Flash Buy Despite Price Stagnation appeared first on Crypto Briefing.

2020-6-20 21:57


4 Indicators Show Bitcoin Has a “High Chance” of Falling in Next 2 Weeks: Analyst

Bitcoin has mounted a strong recovery since the lows seen last week. The leading cryptocurrency traded as high as $9,750 on Saturday, over 13% higher than last weekend’s lows. Even still, there remain textbook technical indicators suggesting there is a “high chance” BTC sees a correction in the coming weeks. According to the analyst that...

2020-6-1 13:00