2021-1-15 19:08 |
The XRP price is currently trading inside a neutral pattern, the breakout/down of which is likely to determine the trend’s direction.
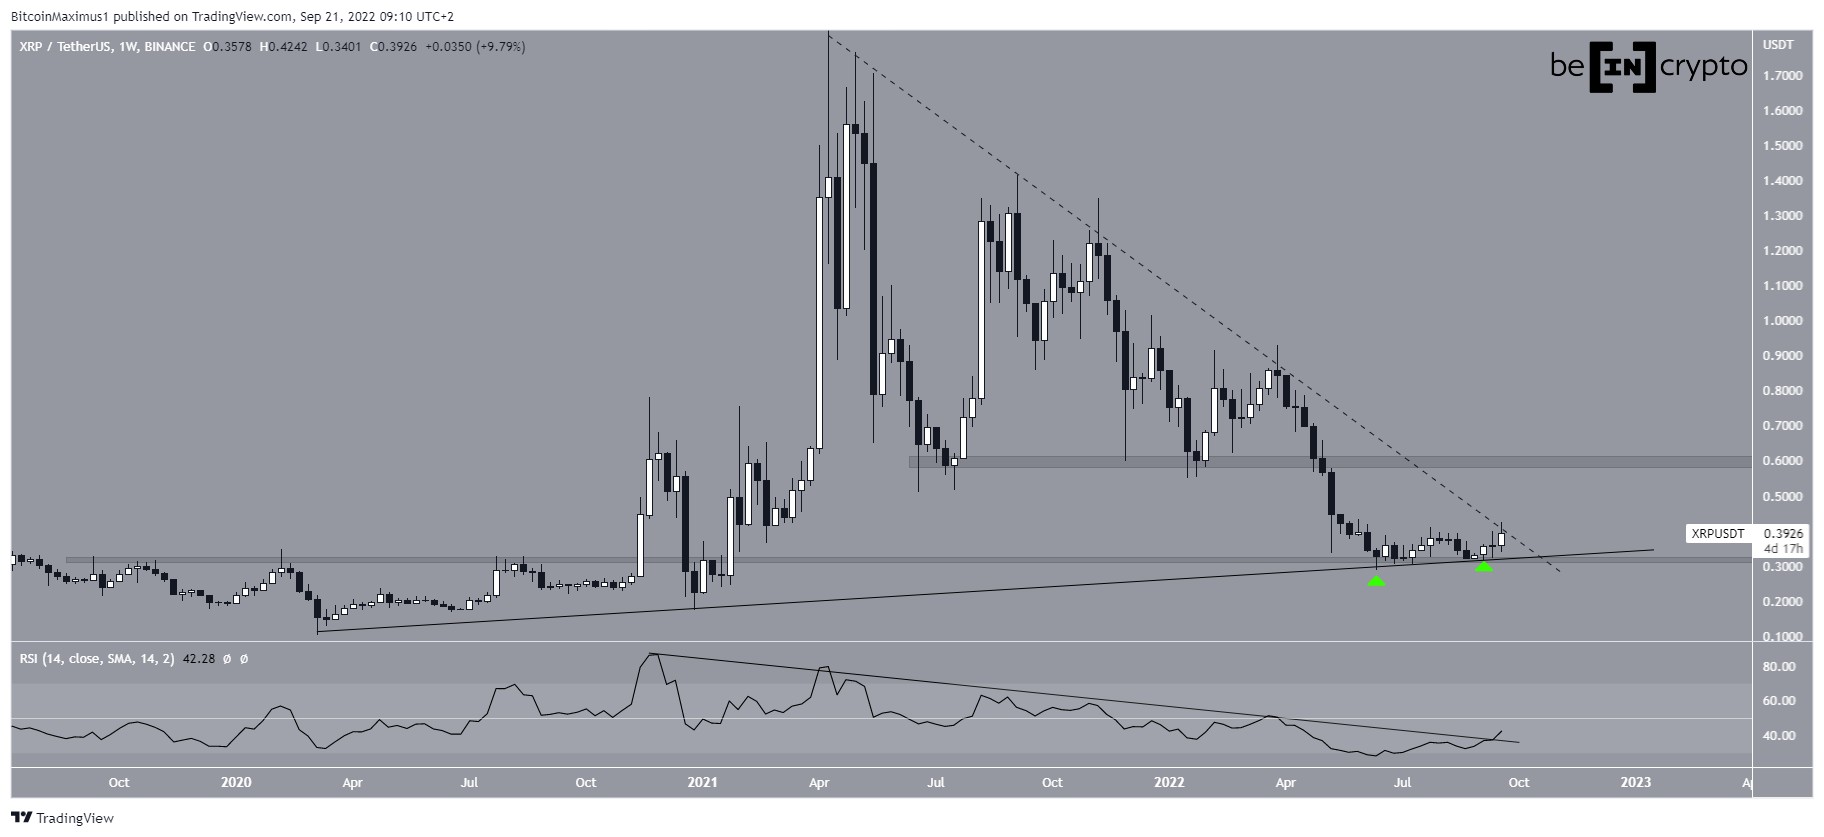
XRP/BTC is following a descending resistance line. The bullish reversal will not be confirmed until the pair breaks out.
This is a shorter-term analysis. For the longer-term one, click here.
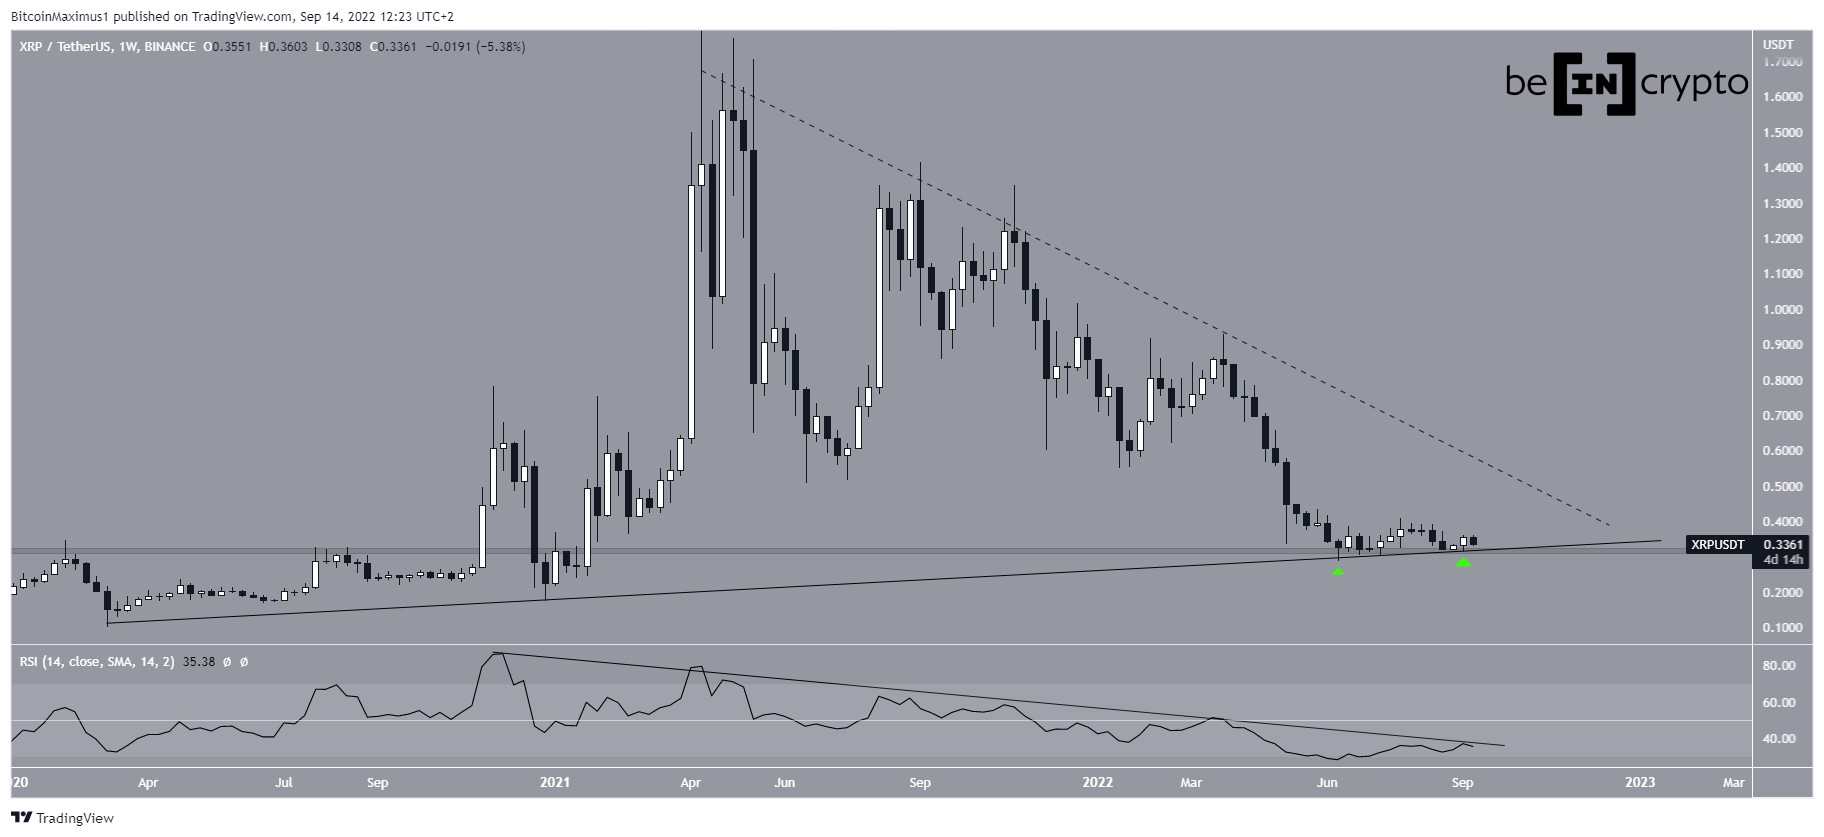
Symmetrical TriangleXRP has been trading inside a symmetrical triangle since it reached a high of $0.385 on Dec.25, 2020. Both the resistance and support lines have been validated three times
At the time of writing, XRP was trading very close to the support line of this triangle. The symmetrical triangle is a neutral pattern, allowing for either a breakout or a breakdown.
While technical indicators are neutral, XRP is trading below the $0.30 area, which previously acted as support and has now turned to resistance. Until it manages to move above it, the short-term trend is bearish.
Chart By TradingView XRP’s Future MovementCryptocurrency trader @Crediblecrypto outlined an XRP chart, stating that a move towards $0.46 is likely.
Source: TwitterThe $0.47 area previously acted as support, and the breakdown below was the catalyst for the acceleration of the downward move. Furthermore, it is the 0.618 Fib retracement level of the entire downward stretch. If XRP manages to clear it, the trend will probably turn bullish.
However, XRP is currently facing resistance from the 0.382 Fib retracement level at $0.35. Technical indicators are gradually turning bullish but have not confirmed the reversal yet.
A price movement above the $0.35 resistance would cause the RSI to move above 50 and the Stochastic oscillator to form a bullish cross. This would somewhat confirm the bullish trend.
Therefore, while a move above $0.47 would definitely indicate that the long-term trend is bullish, even an increase above $0.35 would go a long way in supporting a trend reversal.
Chart By TradingView XRP/BTCThe daily chart shows that XRP/BTC has been following a descending resistance line since Nov. 24, 2020. At the time of writing, XRP was trading just below this support line at 760 satoshis.
While technical indicators on the daily time-frame are bullish, the reversal will not be confirmed until XRP breaks out from the descending resistance line due to the significant bullish divergence in the RSI.
A breakout would likely take XRP towards the 0.382 Fib retracement level at 2037 satoshis.
Chart By TradingView ConclusionTo conclude, the price action and indicator readings for XRP are relatively neutral. Whether XRP breaks out or down from the current pattern will likely determine the direction of the trend.
For BeInCrypto’s latest Bitcoin (BTC) analysis, click here!
Disclaimer: Cryptocurrency trading carries a high level of risk and may not be suitable for all investors. The views expressed in this article do not reflect those of BeInCrypto.
The post XRP Fails to Break Out Above $0.30 – What’s Next? appeared first on BeInCrypto.
origin »Bitcoin price in Telegram @btc_price_every_hour
Ripple (XRP) на Currencies.ru
|
|