1-hour - Свежие новости [ Фото в новостях ] | |

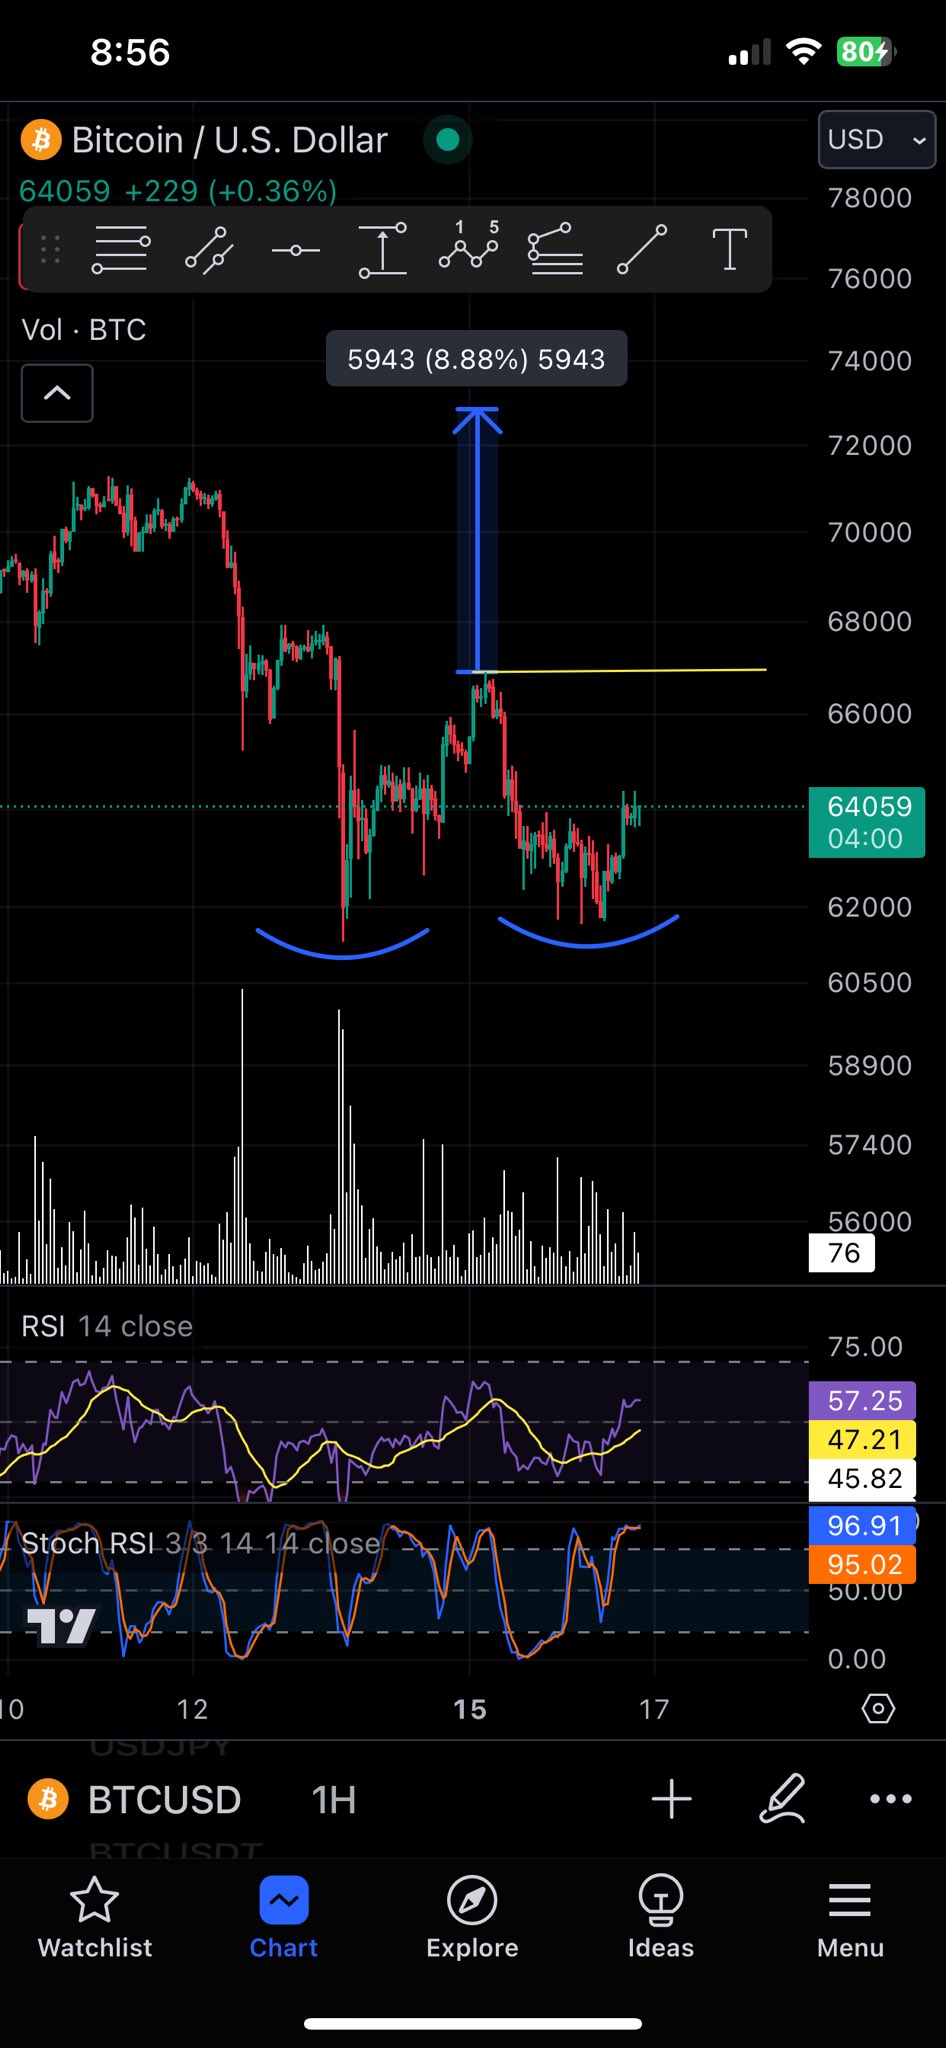
Bitcoin Displays Bullish Adam And Eve Double Bottom: What It Means
In his latest technical analysis, Christopher Inks, a recognized figure in the field of crypto analysis, points to the possible formation of a bullish Adam and Eve double bottom pattern for Bitcoin. This formation is spotted on the BTC/USD 1-hour chart and has significant implications for the cryptocurrency’s short-term price action. дальше »
2024-4-17 11:00 | |
|
|
Ethereum Drops Below The 100-Day Moving Average – What’s Next?
The crypto market is experiencing a pullback after Bitcoin, the leading cryptocurrency, reached a new all-time high. However, Ethereum (ETH) is not left out in this downward move. After setting a new yearly high of $4,094, the price of Ethereum has been moving downward and this has led to the price trading below the 100-day Moving Average (MA) both in the 1-hour and 4-hour timeframes, but this is not so in the daily timeframe. дальше »
2024-3-24 17:31 | |
|
|
Why Is Alchemix (ALCX) Price Up?
The Alchemix token ALCX gained nearly 12% in one hour according to an X crypto alert page from @cryptowise_fin. The account noted it was the largest 1-hour gain for ALCX in at least one year. Large Whale Purchases Precede Rally Further details on the price surge came from @BinanceWhalesAI which tracks large trades on Binance […] The post Why Is Alchemix (ALCX) Price Up? appeared first on CaptainAltcoin. дальше »
2024-2-24 21:30 | |
|
|
Why are cryptos like Bitcoin, Ethereum and XRP crashing?
Bitcoin collapsed to $42,500, triggering a widespread market crash. The 1-hour volume increased while many long positions were wiped out. The enthusiasm about a Bitcoin [BTC] bull run in 202The post Why are cryptos like Bitcoin, Ethereum and XRP crashing? appeared first on AMBCrypto. дальше »
2024-1-3 16:35 | |
|
|

As XRP bulls regain strength, a push to $0.6 could become reality if...
Disclaimer: The information presented does not constitute financial, investment, trading, or other types of advice and is solely the writer’s opinion. -The lower timeframes such as the 1-hour shoThe post As XRP bulls regain strength, a push to $0. дальше »
2023-4-16 06:30 | |
|
|


Solana, ETC and FTM Price Analysis : 06 March
Although the market recovered pretty quickly after 24 February, the bears continued to circle around. The likes of Solana, ETC and FTM projected similar trends on the 1-hour chart. Solana (SOL) The post Solana, ETC and FTM Price Analysis : 06 March appeared first on AMBCrypto. дальше »
2022-3-6 19:00 | |
|
|
Where Bitcoin, Ethereum are headed post 26 November and why
Short-term investors should look away at the moment. Or look closely, depending on one's appetite for fear. Bitcoin, and Ethereum registered their largest 1-hour correction candles over the past few hThe post Where Bitcoin, Ethereum are headed post 26 November and why appeared first on AMBCrypto. дальше »
2021-11-26 17:00 | |
|
|
Crypto Analyst: No Bitcoin Monthly Support Until $14K If Current Level Is Lost
The bulls are given signs of conviction, as Bitcoin reclaims more ground. At the time of writing, BTC’s trades at $36,267 with sideways movement in the 1-hour chart and moderate gains in the 7-day and 30-day chart with 14. дальше »
2021-6-30 20:45 | |
|
|
Is the worst finally over for Bitcoin?
Market perspective is vital while analyzing the trend of an asset. Consider this - Observing Bitcoin's 1-hour chart at the moment could completely demoralize potential investors. However, the 1-day orThe post Is the worst finally over for Bitcoin? appeared first on AMBCrypto. дальше »
2021-5-29 18:00 | |
|
|
Buy Signal? “Chart Master” Calls For $29K Bitcoin on CNBC
Still in the red, Bitcoin and the crypto market have held the line in the past day. A bounce back seems feasibly, but not guaranteed. At the time of writing, BTC trades at $42,913 with sideway movement in the 1-hour chart and a 20% correction in the weekly and monthly chart. The crypto market is […] дальше »
2021-5-18 18:17 | |
|
|
Here Is Why XRP Volume Has Recover Across Payment Corridors
XRP has picked bullish momentum in the 1-hour chart with a 4. 7% increase. Higher timeframes seem equally bullish with the weekly and monthly chart recording a 7. 8% and 154% rally, respectively. XRP price performance has recovered since the start of 2021 when the token experienced a severe correction. дальше »
2021-5-5 01:57 | |
|
|
After The Crash: Why Bitcoin Could Have More Upside Potential
Bitcoin is holding well above the critical support at $47,000. Trading at $50. 067 with 1. 6% in the 1-hour chart and sideways movement in the 24-hour chart, BTC seems to be on a path to recovery on the lower timeframes. дальше »
2021-4-25 22:00 | |
|
|
Cardano short-term price analysis: 26 August
Cardano's surge, like most altcoins, seems to have come to standstill. The price of ADA has dropped approximately 23% in the last week and 6.7% in the last 24 hours. Cardano 1-hour chart ADAUSD TraThe post Cardano short-term price analysis: 26 August appeared first on AMBCrypto. дальше »
2020-8-27 21:00 | |
|
|
With few blocks away from Halving, here’s how Bitcoin has been performing so far today
Today has been extremely volatile for Bitcoin breaking above $9,000 just to crash in the next few hours. We are seeing a 1% price move on 1-minute candlesticks all the time. However, even after such high volatility Bitcoin is still trading around $8,500, the midpoint between $9,200 and $8,000 basically. Looking at the 1-hour chart, […] дальше »
2020-5-12 22:00 | |
|
|
Bitcoin price plummets to $5,200 in a 1-hour shock crash, liquidating $665 million
The Bitcoin price crashed from $7,400 to $5,200 in just one hour, liquidating a staggering $665 million worth of long contracts. Bitcoin dropped below the highly anticipated weekly 200-day exponential moving average (EMA), making it one of the steepest single-day drops in the history of the market. дальше »
2020-3-13 14:20 | |
|
|
XRP NVT ratio indicates high growth phase or unsustainable bubble
Despite 60% gains for XRP from the start of the year, the cryptocurrency's dip under the $0.30 mark has investors concerned. An analysis of the 1-hour chart indicated two possible outcomes for XRP in The post XRP NVT ratio indicates high growth phase or unsustainable bubble appeared first on AMBCrypto. дальше »
2020-2-20 23:00 | |
|
|
Ethereum’s consolidation under $190 may continue
Over the past few days, Ethereum was exhibiting a sideways movement in the chart. The altcoin continued to lose valuation after the slump on 24th September but significant bullish signs were prominent in the short-term analysis. дальше »
2019-10-23 02:30 | |
|
|
XRP’s rising trend may be hampered by breach of ascending channel
XRP’s price has been bearish for most of 2019, but spurts of growth have pleased holders of the token. After noting a peak in June, XRP has plunged to $0. 2923 with a market cap of $12. 63 billion. дальше »
2019-10-18 16:30 | |
|
|
Bitcoin set for market correction, but Fibonacci retracement lines give buyers upper hand
Bitcoin managed to see some bullish momentum on 9 October, taking its prices over the $8,000 mark after a continuous struggle to remain above the $8k mark since 24 September’s massive fall. At press time, Bitcoin was trading at $8,518 with a gain of 3. дальше »
2019-10-10 16:45 | |
|
|
XRP’s restricted price may notice a boost with breach of ascending triangle
XRP’s price was restricted between $0. 2600 and $0. 2400, in light of various developments that occurred ints ecosystem. 1-hour The 1-hour chart of XRP exhibited the formation of a symmetrical triangle, that extended from the end of September to October. дальше »
2019-10-6 14:39 | |
|
|

Litecoin Price Analysis: LTC Poised For Bullish Reversal
Litecoin has recently broken out of a descending channel on the Bitcoin pair and looks poised for a bullish reversal as Bitcoin continues to create lower lows. Traders speculate Bitcoins decline could fuel a Litecoin pump over the coming days. дальше »
2019-9-30 18:21 | |
|
|
Ethereum prices might slump further in short term with a bearish potential double-top formation
Ethereum has been on a recovery mode since 24th September which saw the second-largest altcoin lose almost 17% of its value in a single day. ETH was trading at $172. 24 at press time having seen a decline of 1. дальше »
2019-9-29 13:50 | |
|
|
Litecoin’s price could spiral below key support after symmetrical triangle closes
Over the last week, Litecoin has lost over 24% and the coin has failed to rebound and was priced at $54.93 at press time, after falling 1.86% in the past one hour. The silver crypto had dramatically lost value over the past month and this trend has been continuing since its halving. Litecoin 1-hour Chart: […] дальше »
2019-9-29 12:11 | |
|
|
Tron prices might decline further as the short-term chart looks bearish with sellers having an upper hand
Tron the 14th largest cryptocurrency by market cap has been struggling to gain the lost grounds of 24th September when its price fell from $0. 0143 to $0. 0115. It was trading at $0. 0136 at press time, having seen a decline of 0. дальше »
2019-9-29 11:00 | |
|
|
Tron’s short-term future could be bearish as charts indicate ascending channel formation
Tron was trading at $0. 0135 at press time, recording a gain of 2. 91% on the 24-hour price chart. The token had a support at $0. 0129, while it needs to break through the resistance placed at $0. 0138. дальше »
2019-9-28 15:50 | |
|
|
XRP’s price may note an uptrend as coin prepares to breach ascending triangle pattern
XRP’s price rejoiced in the bullish waves from early September. However, that growth was obstructed by the bear attack. Despite the fall, the price of XRP did see some upward movement as it neared the breaching of an imminent bullish pattern. дальше »
2019-9-28 12:25 | |
|
|
Cardano prepares for a price breakout in the short term as charts reveal formation of an ascending triangle
The crypto-market is on a consolidating spree after a massive fall on Wednesday, wherein most of the altcoins were in the red and saw a double-digits decline. Cardano [ADA], currently ranked 12th on CoinMarketcap, was trading at $0. дальше »
2019-9-28 11:15 | |
|
|
Bitcoin Price Analysis: BTC Dumps To $8k As Market Trembles
After much anticipation of an explosive move, Bitcoin has finally chosen a direction for the short-term dumping through the asymmetrical triangle support. Current market price rests on $8,100 support but looks poised to drop further. дальше »
2019-9-26 18:14 | |
|
|
Ethereum price analysis: Bears have upper hand as selling pressure on rise
The largest altcoin, Ethereum was trading at $167. 56 with a total market cap of over $18 billion at press time. The cryptocurrency had a trade volume of $5. 2 billion in the last 24 hours, and did not record a significant rise or fall. дальше »
2019-9-28 18:06 | |
|
|

Binance Coin Price Analysis: BNB Creates Lower and Plunges To $18
Binance coin has yet to see any relief as bears force price action to create a third lower low. The current market price rests of a key support line at $18. 9 and will determine whether price levels drop further. дальше »
2019-9-25 18:05 | |
|
|

Bitcoin Price Analysis: BTC Poised For Drop To $7,200 as Altcoins Tumble
Bitcoins price movements have been quite slow over the past few weeks as price action consolidates around the $10,000 mark. Volume remains low and price action looks poised for a drop below $9,000 over the coming days. дальше »
2019-9-23 13:12 | |
|
|
Bitcoin Price analysis: Market has very less volatility, but bearish sentiment is more prominent
Bitcoin was trading at $10,043 at press time with a minimal gain of 0.43% on the 24-hr price chart. The total market cap of the coin stood at $180 billion. 1-Hour Price Chart In the 1-hour price chart, Bitcoin is exhibiting very less volatility with the immediate support forming at $9974.84. Bitcoin needs to break […] дальше »
2019-9-28 16:13 | |
|
|
XRP price takes a hit as coin breaches out of descending triangle pattern in short term
Despite the boost in its price, XRP failed to hold the price above $0. 30 and slipped back to its bearish price zone. Short term charts of the coin suggested a breach of bearish pattern, after which its price stood at $0. дальше »
2019-9-22 11:26 | |
|
|
XRP’s price may come under attack as coin moves towards breaching descending triangle
The spiraling price of XRP had built up enough potential energy to bounce by a staggering 27% on 19 September. The price of the coin peaked at $0. 3292, following which it was on a descent, at press time. дальше »
2019-9-21 17:00 | |
|
|
Bitcoin looks to breakout above descending channel, but bearish sentiment may limit upward momentum
Bitcoin was trading at $10,105 at the time of writing, with the coin recording a fall of 0. 83% over 24 hours. The king coin has maintained its position above $10k since its fall on 19 September, with its price fluctuating between $10,100 and $10,350. дальше »
2019-9-21 13:07 | |
|
|
Stellar Lumens forming a bearish double-top in the short-term, but bullish respite may be on the horizon
The cryptocurrency market saw most altcoins surging over the past 24 hours. However, that momentum did not last long as the market correction neutralized a majority of these gains, except for Stellar lumens’ (XLM). дальше »
2019-9-19 17:00 | |
|
|
XRP’s likely bullish breakout may lack significant momentum
After consolidating under the $0. 260 mark for a majority of last week, XRP’s price exhibited a growth of over 4 percent which improved its valuation to $0. 265 on 14th Sept. XRP’s value underwent correction afterward and at press time, was valued at $0. дальше »
2019-9-16 18:30 | |
|
|
XRP exhibits another descending triangle as valuation nears 20-month long price bottom
The last 24 hours have been relatively positive for XRP’s valuation as the third-largest digital asset witnessed a 4 percent hike in 24 hours. The price breached short-term resistance at $0. дальше »
2019-9-15 16:56 | |
|
|
Litecoin could start its road to recovery if it breaks out of the parallel channel
Weeks after breaking into its Death Cross, Litecoin is looking more bearish than ever. The fifth-largest cryptocurrency on the market is trudging downward yet again, looking to sustain below the $70 range after breaking above for a brief period earlier this month. дальше »
2019-9-14 16:07 | |
|
|

Bitcoin Price Analysis: Falling Wedge Spotted At $10,000
Bitcoin price levels quickly bounced off the triangle support at $9,400 back up to just below $11,000 at the beginning of September. Since then BTC has formed a falling wedge and looks poised for another move up. дальше »
2019-9-11 15:26 | |
|
|

Bitcoin Price Analysis: Breakout to $11,000 Looming
Bitcoin has been trading around $10,500 for the last few days as price levels begin to form rising support. The question remains as to whether enough volume will enter Bitcoin in order for price levels to break up-wards through key resistance at $11,00o. дальше »
2019-9-5 19:28 | |
|
|

Bitcoin Price Analysis: Bullish Divergence Causes Price Levels To Pump
Bitcoin bounced right off of the key triangle support on all time-frames at $9,350 on the 30th of August causing bullish divergence to play out. Since then price levels have pumped to $10,700 as price levels near a key breakout point. дальше »
2019-9-4 18:34 | |
|
|
XRP’s breach of symmetrical triangle likely to boost short-term price
XRP’s price has witnessed substantial volatility; over the past two weeks, XRP’s price slumped on various occasions but the valuation managed to exhibit a minor hike. 1-hour chart In the 1-hour chart, it can be observed that the coin’s movement adhered to a falling wedge pattern before a bearish breakout unfolded. дальше »
2019-9-2 16:41 | |
|
|
Bitcoin Price Analysis: $9,400 Key Support Holds For Now
Bitcoin’s volatility has drastically decreased over the last few weeks as price action unfolds close to key support at $9,400. This key support line creates the bottom of the asymmetrical triangle stemming from $14,000 down to $9,400 mentioned in a previous analysis on Bitcoin. дальше »
2019-8-31 20:23 | |
|
|

Bitcoin Price Analysis: $10,000 Sees Bulls Accumulating
Since the recent drop from $11,000 t0 $9,800 as outlined in my previous analysis on BTC, price levels have created an asymmetrical triangle and will see a breakout next week. Bitcoin 1-Hour Analysis On the 1 hour chart for XBT/USD, we can see the asymmetrical triangle highlighted after the breakdown from the rising wedge as mentioned in my previous analysis on Bitcoin. дальше »
2019-8-27 20:14 | |
|
|

Bitcoin Price Analysis: Bullish Divergence Forms At $10K, is $11K Next?
Bitcoin breaks 5-day long up-trend, dropping back to key support levels at $9,800. Since then bullish divergence appears to have formed on lower time-frames and could spur a reversal in the coming days. дальше »
2019-8-23 19:03 | |
|
|