Bitcoin Displays Bullish Adam And Eve Double Bottom: What It Means

Bitcoin Displays Bullish Adam And Eve Double Bottom: What It Means
фото показано с : newsbtc.com

2024-4-17 11:00

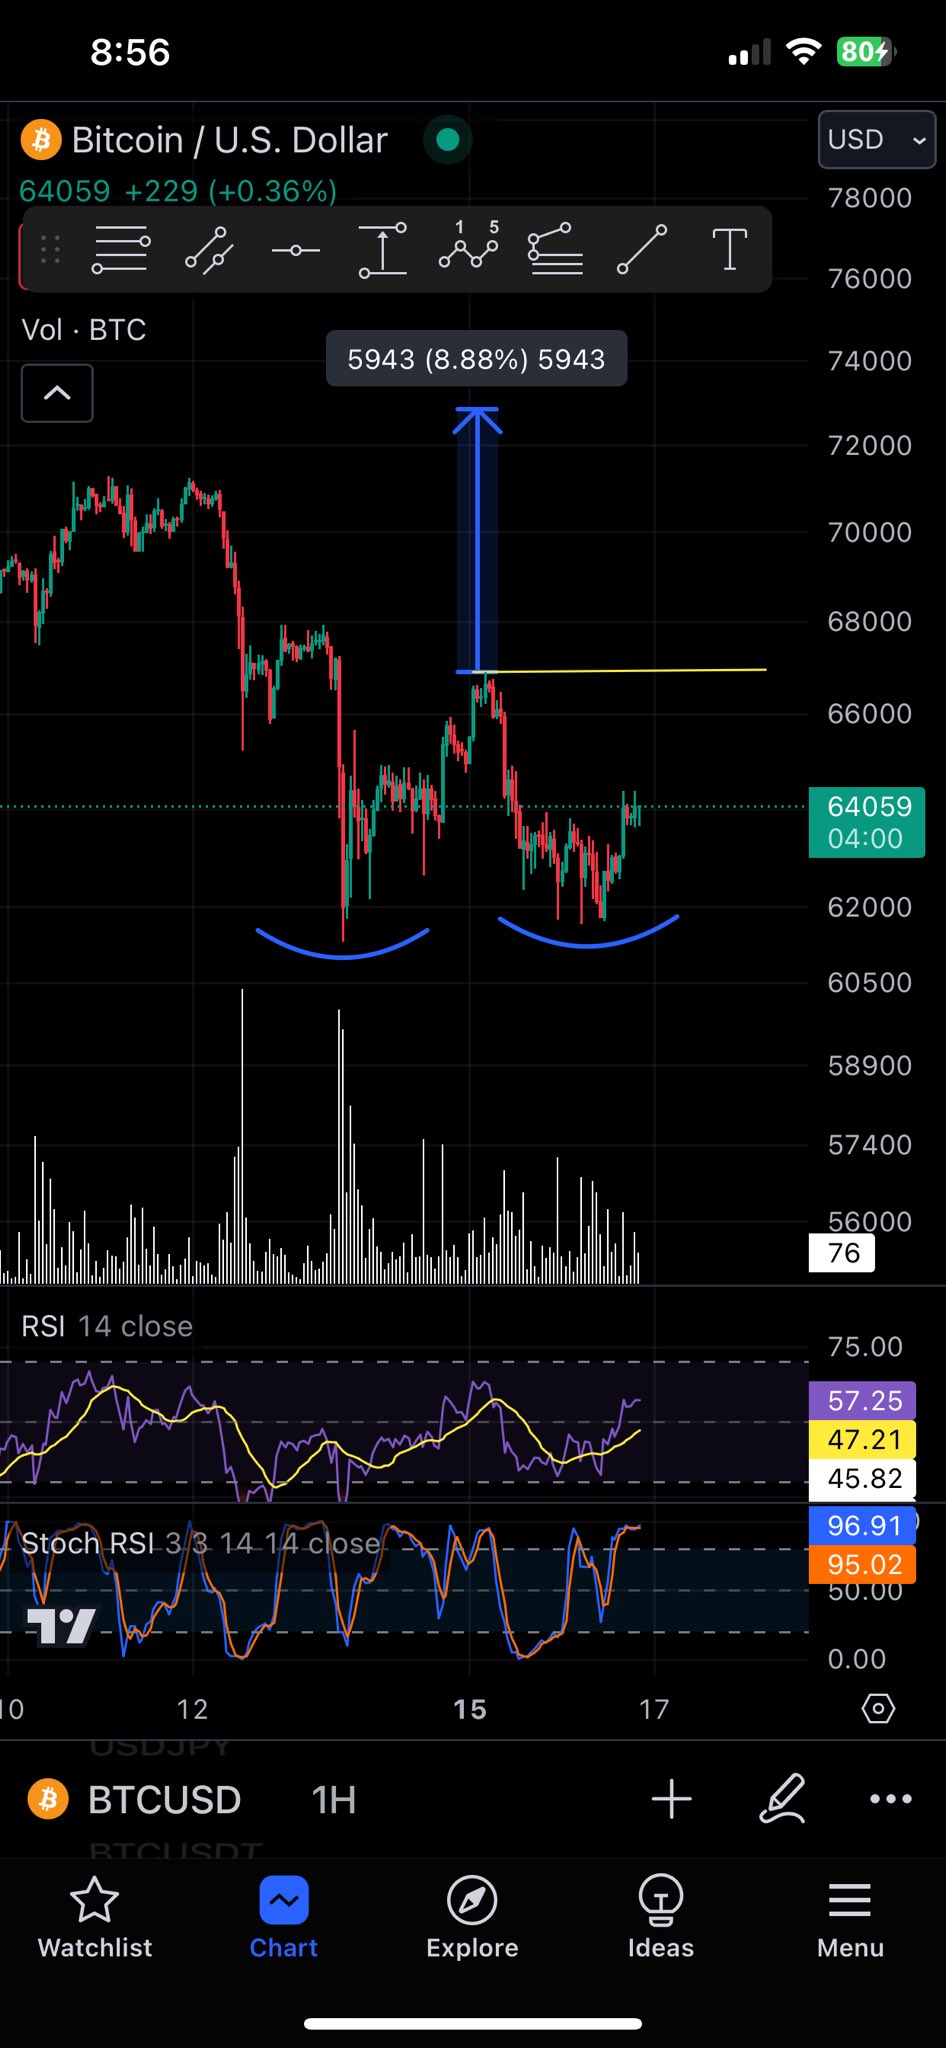
In his latest technical analysis, Christopher Inks, a recognized figure in the field of crypto analysis, points to the possible formation of a bullish Adam and Eve double bottom pattern for Bitcoin. This formation is spotted on the BTC/USD 1-hour chart and has significant implications for the cryptocurrency’s short-term price action.

The chart depicts Bitcoin’s price movement with a distinct pattern that resembles two troughs with a peak in between. The first trough, known as the “Adam,” is characterized by a sharp, V-shaped bottom, indicating a rapid price decline and equally swift rebound. This is followed by a more rounded, gradual, and wider “Eve” trough, suggesting a slower and more deliberate price recovery.

Bitcoin Targets Its All-Time High

In this analysis, the price level to watch is marked by a horizontal yellow line, which Inks suggests is the neckline of the pattern. A breakout and close above this neckline would confirm the pattern, signaling a potential bullish reversal. The importance of this neckline, which lies around the $67,000 price level, cannot be overstated as it represents a key resistance point that the price needs to surpass to confirm the pattern.

To derive the target of the pattern, Inks uses the depth of the formation, measuring from the neckline to the lowest point of the Adam trough. This height (8.88%) is then projected upward from the breakout point, suggesting that the pattern target would be in the area of $73,000, close to Bitcoin’s all-time high (ATH).

Other technical indicators on the chart include volume, the Relative Strength Index (RSI), and the Stochastic RSI. Volume, denoted at the bottom of the chart, has shown a significant peak at the formation of the Adam bottom, followed by less pronounced volume during the formation of the Eve. This volume profile often accompanies the Adam and Eve pattern and can serve as a confirmation signal of the bullish sentiment.

The RSI, a momentum oscillator that measures the speed and change of price movements, is at 47, neutral territory, showing that neither bulls nor bears have gained full control yet. The Stochastic RSI, a more sensitive indicator that combines the features of stochastic oscillators and RSI, is indicating a strong upward momentum, with a reading above 95 out of 100, which could suggest potential for a short-term pullback due to overbought conditions.

Finally, it’s important to note that the Stochastic RSI is showing a crossover in the overbought territory, which can sometimes precede a price correction. However, given the bullish pattern indicated by the Adam and Eve formation, the sentiment appears to lean towards an optimistic outlook. If BTC price breaks above $67,000 and closes a hour-candle above this threshold, the bulls could target the all-time high at $73,780.

At press time, BTC traded at $63,571.

Similar to Notcoin - TapSwap on Solana Airdrops In 2024

origin »

Devery (EVE) на Currencies.ru

$ 0.0029171 (-1.36%)
Объем 24H $9.913k
Изменеия 24h: 1.90 %, 7d: -33.65 %
Cегодня L: $0.0029171 - H: $0.0029171
Капитализация $183.538k Rank 1659
Доступно / Всего 62.917m EVE

analysis bitcoin formation adam eve double bottom

analysis bitcoin → Результатов: 126


The End of Bitcoin Woes? BTCUSD Analysis October 11, 2022

In this episode of NewsBTC’s daily technical analysis videos, we examine a possible bottoming scenario in Bitcoin price based on a potential expanded flat correction and an ending diagonal. Take a look at the video below: VIDEO: Bitcoin Price Analysis (BTCUSD): October 11, 2022 Bears and bulls are battling it out once again, each side trying to take control over daily momentum.

2022-10-12 22:51


Фото:

Bitcoin Price Analysis: $10,000 Sees Bulls Accumulating

Since the recent drop from $11,000 t0 $9,800 as outlined in my previous analysis on BTC, price levels have created an asymmetrical triangle and will see a breakout next week. Bitcoin 1-Hour Analysis On the 1 hour chart for XBT/USD, we can see the asymmetrical triangle highlighted after the breakdown from the rising wedge as mentioned in my previous analysis on Bitcoin.

2019-8-27 20:14


Ethereum Leads in Active Developers, Bitcoin’s Developer Count Healthy, Litecoin and Dogecoin “Being Abandoned”

Ethereum is strongly leading in the total number of active developers working on both its core protocol and in total development; Bitcoin boasts a strong developer ecosystem 10 years after launch, while Litecoin and Dogecoin are “being abandoned,” according to an analysis by one crypto venture capital firm.

2019-3-18 08:50


Фото:

Litecoin Price Analysis: Hitting Major Resistance

The Litecoin (LTC) price continues to surge following an impressive run over the past month — but is it ripe for a pullback? Let’s take a look. Fibonacci Retracement If we take a look at the Fibonacci retracement tool and draw a simple line from the all-time high to its most recent bottom, we can see that the price of Litecoin (LTC) against Bitcoin (BTC) has largely respected each channel while stair-stepping upwards.

2019-3-16 10:30


Фото:

Bitcoin Price Analysis: Could Three Times Be the Charm for This Resistance Level?

Bitcoin remains in its tightly coiled range as the market continues its sideways trend for the third week in a row. While macro support has been tested three times recently, we have yet to test the overhanging macro resistance:Figure 1: BTC-USD, Daily Candles, Narrow RangeThe blue zone outlined above shows a very strong zone of support that, over the last few weeks, has seen three strong tests and has led to a slowly upward-drifting market consolidation.

2019-3-16 01:56


Today’s Top Crypto Coin Price Predictions: Bitcoin (BTC), Ethereum (ETH), Litecoin (LTC) and EOS Forecast

Welcome to Today's BitcoinExchangeGuide.com top cryptocurrency coin price prediction and forecast analysis overview. We will be reviewing four coins today in Bitcoin, Ethereum, Litecoin and EOS. Today's Bitcoin Price Prediction (BTC/USD) From yesterday things haven’t changed much for the price of Bitcoin as it is still hovering around the same level. On yesterday’s open the […]

2019-3-14 19:23