Will Bitcoin complete the double bottom pattern or has the bull run actually started?

2019-4-29 01:30

Bitcoin collapsed by 9% on almost all exchanges when the Bitfinex and Tether news broke out, however, on Kraken, the price fell as low as, ~$4,300.

Based on past data, it can be assumed [with a grain of salt] that there is a possibility of the formation of a double bottom pattern, as it did in 2015 when the whole community believed that Bitcoin had started the bull run after the first bottom.

Source: TradingView

The Death Cross, formed in September of 2014, pushed the price of Bitcoin from $556 to $187, which was followed by a fake Golden Cross, which was mistaken signal of the start of a bull run. However, the price decided to dip again, forming another Death Cross followed by another Golden Cross, which was the start of the actual bull run. During this time frame, two bottoms, one in, January 15, 2015, and the other, in August 2015, were formed.

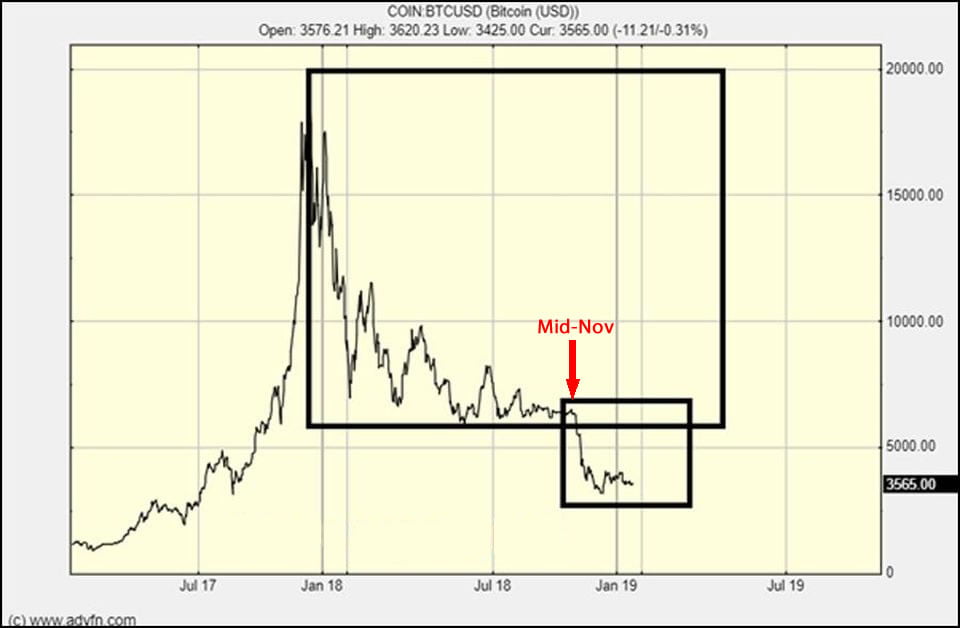
At press time, the same pattern seemed to be forming, as the first bottom was witnessed on December 15, 2018, which was followed by a Golden Cross. The community speculated that this could be the start of the bull run, which could be wrong. Assuming that the price takes the same 115 days it took in 2015, the next bottom might take place in the month of July 2019, after which the second Golden Cross could be formed, indicating the actual start of the rally.

If this theory holds true, it could put the price a bit higher than the previous bottom [$3,200], i.e., somewhere around $3,250 to $3,400.

There is, however, another possibility of Bitcoin moving lower than what was previously imagined, which would make the price movement of Bitcoin in December 2018, a step towards the actual bottom. This was discussed in the previous article about the fractal nature of Bitcoin and how fractals are a representation of human emotion and can be found everywhere in nature and hence could be assumed that this cycle repeats itself.

The post Will Bitcoin complete the double bottom pattern or has the bull run actually started? appeared first on AMBCrypto.

Similar to Notcoin - Blum - Airdrops In 2024

origin »

Bitcoin (BTC) на Currencies.ru

$ 67481.13 (-0.30%)
Объем 24H $27.005b
Изменеия 24h: -1.42 %, 7d: -2.08 %
Cегодня L: $67324.34 - H: $67602.6
Капитализация $1326.705b Rank 1
Цена в час новости $ 5305.2 (1171.98%)

pattern bottom double bitcoin started actually complete

pattern bottom → Результатов: 51


Криптоаналитик Джош Рейджер: В июле нас ждёт уверенный рост цены биткоина

Трейдер и криптоаналитик Джош Рейджер предположил, что фаза накопления биткоина продлится до середины июля, затем последует уверенный рост цены. $BTC Accumulation Pattern It took Bitcoin 216 days for accumulation from bottom to spring in 2015 If this were accumulation, this week's $1000 candle would be the exact middle of 216 accumulation days and would end […] Запись Криптоаналитик Джош Рейджер: В июле нас ждёт уверенный рост цены биткоина впервые появилась Криптовалюта.Tech.

2019-4-7 16:23


Аналитик: стремительный рост цены биткоина начнется в середине июля

Трейдер и криптоаналитик Джош Рейджер предположил, что фаза накопления биткоина продлится до середины июля, затем последует уверенный рост цены. $BTC Accumulation Pattern It took Bitcoin 216 days for accumulation from bottom to spring in 2015 If this were accumulation, this week’s $1000 candle would be the exact middle of 216 accumulation days and would end […]

2019-4-7 13:36


Фото:

Bitcoin Price Analysis: Range-Bound Market Coiled for Next Move

For the better part of a month and a half, bitcoin has been fairly range-bound and unable to establish new lows or new highs. There are some bullish and bearish setups on the horizon for bitcoin, so let’s check out both sides of the argument because currently the market is sitting in the middle of Indecisionville — the most immediate sign of which is this glaringly obvious head-and-shoulders bottom reversal pattern:Figure 1: BTC-USD, Daily Candles, Head-and-Shoulders BottomThis current pattern is nothing more than a setup at the moment, but it represents one potential outcome of this sustained consolidation.

2019-1-4 02:22


Ethereum Price Analysis | November 30, 2018

Supply levels: $124, $139, $151 Demand levels: $113, $102, $91 ETH/USD Medium-term Trend: Ranging On the medium-term outlook, ETH/USD is ranging. There was a bullish momentum from the bottomed price level of $102 towards the supply level of $124 which serves as the last part to complete the “double bottom” pattern formed on the 4-Hour […] The post Ethereum Price Analysis | November 30, 2018 appeared first on ZyCrypto.

2018-11-30 13:35