2022-7-28 12:45 |
Despite breaking out from a long-term descending resistance line, the Sandbox (SAND) is trading inside a corrective short-term pattern. The direction of the trend is still undetermined.
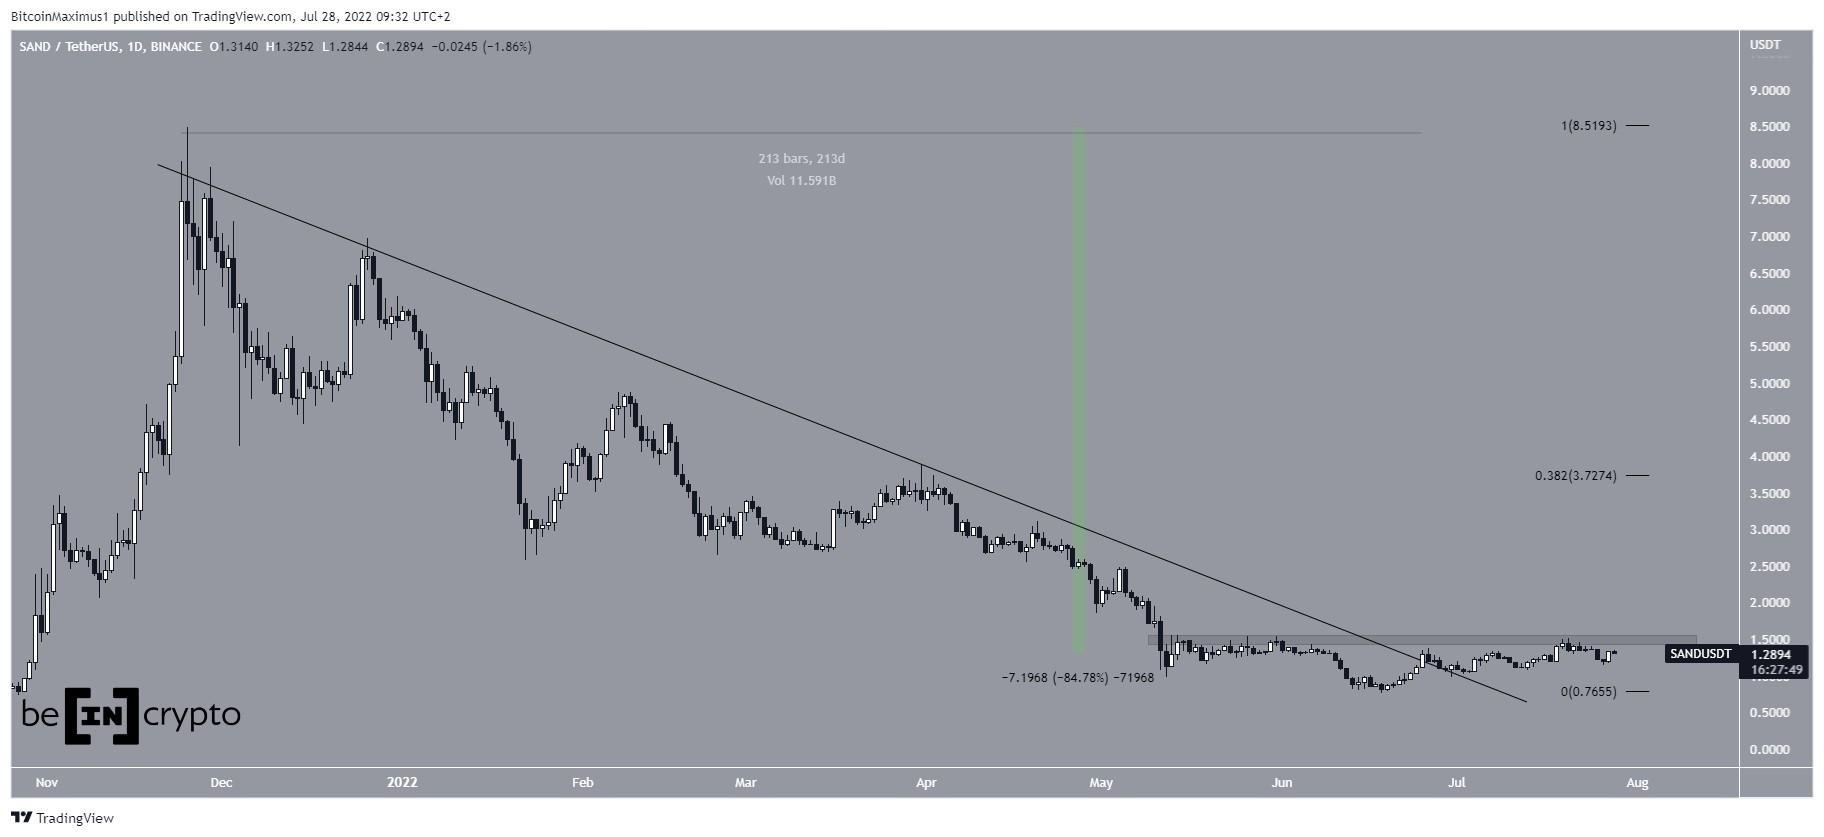
SAND had been falling underneath a descending resistance line since reaching an all-time high price of $8.50 in Nov. The downward movement led to a low of $0.74 on June 18, 2022.
Afterward, the price began an upward movement and managed to break out from the line on June 25. At the time, the line had been in place for 213 days. Even though a month has passed since the breakout, the price is still hovering close to the breakout level. Measuring from the all-time high, it has decreased by 85%.
The closest horizontal resistance is at $1.45 while the closest Fib resistance is at $3.75.
SAND/USDT Chart By TradingView Short-term movementThe daily chart does not provide decisive signs as to what is the direction of the trend. While SAND has reclaimed the $1.10 horizontal level after previously deviating below it, the daily RSI is moving freely above and below 50. This is considered a sign of neutral trends.
SAND/USDT Chart By TradingViewCryptocurrency trader @eliz883 tweeted a chart of SAND which shows a short-term breakout.
Source: TwitterHowever, since the tweet, the price has decreased considerably and is trading in the lower portion of an ascending parallel channel, which is considered a corrective pattern. Moreover, it has been rejected by the $1.30 horizontal resistance area (red icon).
Until it manages to reclaim the middle of the channel, the trend cannot be considered bullish.
SAND/USDT Chart By TradingView SAND wave count analysisDue to the considerable overlap in the movement inside the channel, it is possible that the movement contains a completed A-B-C running flat correction (red icon).
If so, an upward movement towards $1.75 could transpire, giving both portions of the increase (highlighted) a 1:1 ratio.
However, a breakdown from the channel would invalidate this particular wave count and suggest that the trend is bearish instead.
SAND/USDT Chart By TradingViewFor Be[in]Crypto’s latest Bitcoin (BTC) analysis, click here
The post The Sandbox (SAND) Breaks out From 213-Day Resistance Line appeared first on BeInCrypto.
origin »Bitcoin price in Telegram @btc_price_every_hour
Resistance (RES) на Currencies.ru
|
|