2022-7-15 18:00 |
Beam (BEAM) is currently attempting to find support after retracing due to a sharp increase on July 13 which eventually led to the creation of a long upper wick.
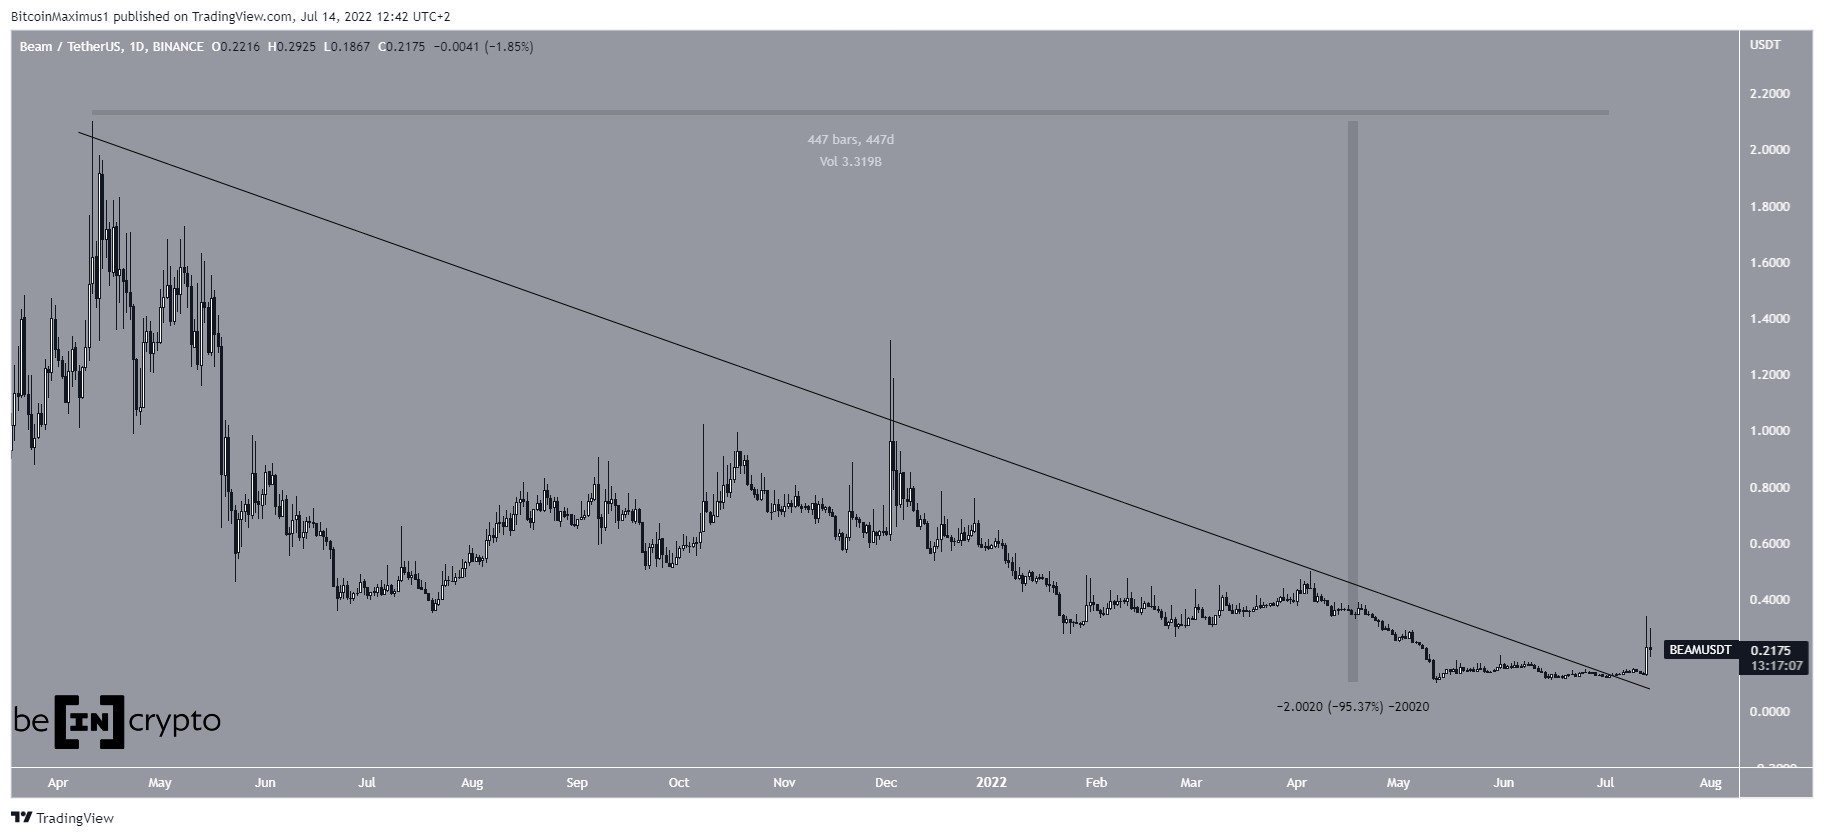
BEAM has been falling underneath a descending resistance line since reaching an all-time high of $2.10 in April 2021. The downward movement led to a new all-time low of $0.093 on May 13. This amounted to a decrease of 95% since the all-time high.
Afterward, the price initiated an upward movement and managed to break out on July 3. Therefore, the line stood for 447 days prior to a breakout. So, it is possible that this is the beginning of a bullish trend reversal due to the fact that such a long-term structure is no longer in place.
BEAM/USDT Chart By TradingView RSI breaks outA closer look at the daily chart shows that the upward movement ended once the price reached the $0.295 horizontal area. This in turn created a long upper wick (red icon), which is considered a sign of selling pressure. The $0.295 area is very important, since it previously had acted as support. Due to the aforementioned rejection, the area has now turned to resistance.
The daily RSI reading is bullish, supporting the continuation of the upward movement. The indicator is following an ascending support line (green line) and has moved above 50.
So, this supports the continuation of the upward movement and another breakout attempt above $0.295. If it is successful in moving above it, the next resistance area would be at $0.45.
BEAM/USDT Chart By TradingView Short-term BEAM breakoutFinally, the six-hour chart shows that the price has broken out from an ascending parallel channel. Afterward, it returned to validate it as support on July 13 (green icon).
So, if the price manages to hold on above the resistance line of the channel, it would be expected to increase towards the previously outlined horizontal resistance area.
BEAM/USDT Chart By TradingViewFor Be[in]Crypto’s latest bitcoin (BTC) analysis, click here.
The post BEAM Seeks Support After Break Out From 447-Day Resistance Line appeared first on BeInCrypto.
origin »Bitcoin price in Telegram @btc_price_every_hour
Beam (BEAM) на Currencies.ru
|
|